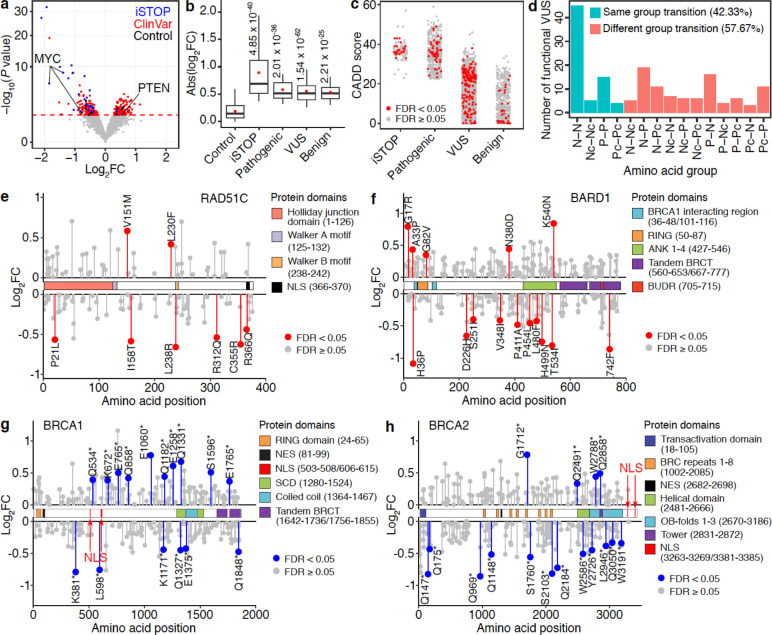
Fig 4. Functional clinical variants identified using PRIME.
(a) Functional clinical variants (red) with either a positive or a negative impact on cell growth were determined by relative effects on cell fitness between Alt and Ref alleles. Blue dots represent significant iSTOPs, and black dots represent negative controls. The red dashed line indicates 5% FDR. (b) Effect sizes of identified functional iSTOPs and clinical variants are larger than that of negative controls (P values were calculated by two-tailed two-sample t-test). Box plots indicate the median, IQR, Q1 − 1.5 × IQR, and Q3 + 1.5 × IQR. Red dots indicate the mean. (c) CADD scores for iSTOPs and clinical variants. (d) Number of identified functional VUS causing each amino acid group transition. (N, Nonpolar; P, Polar; Pc, Positively charged; Nc, Negatively charged). (e,f) Lollipop plots of functional VUS in RAD51C and BARD1 mapped to their canonical isoforms. The identified significant VUSs are labeled in red. Their effects on cell growth are indicated by fold changes. (g,h) Lollipop plots of the nonsense variants in BRCA1 and BRCA2 mapped to their canonical isoforms. The identified significant hits are labeled in blue. Their effects on cell growth are indicated by fold changes.

