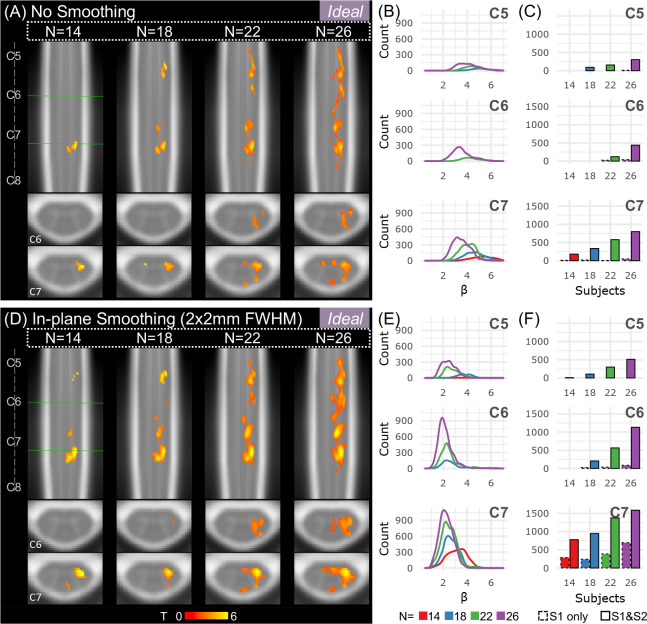
Figure 6. Effects of sample size and spatial smoothing on activation mapping and parameter estimates for the Ideal model, L>0.
(A) Spinal cord activation map for each sample size: N=14, 18, 22, and 26 participants (S1 & S2). Significant t-statistics are shown (p<0.05, FWE-corrected). (B) Density plot distribution of significant parameter estimates for each probabilistic spinal cord segment: C5, C6, and C7 (S1 & S2). (C) Number of active voxels in each cord segment for incremental sample sizes using only 1 run (S1 only, 10 min) or 2 runs (S1 & S2, 20 min) for each probabilistic spinal cord segment: C5, C6, and C7. Significant voxels in the C8 segment were very few so are not shown. (D-F) Same as A-C for data that were smoothed in-plane within a spinal cord mask using a 2×2mm2 FWHM Gaussian smoothing kernel.

