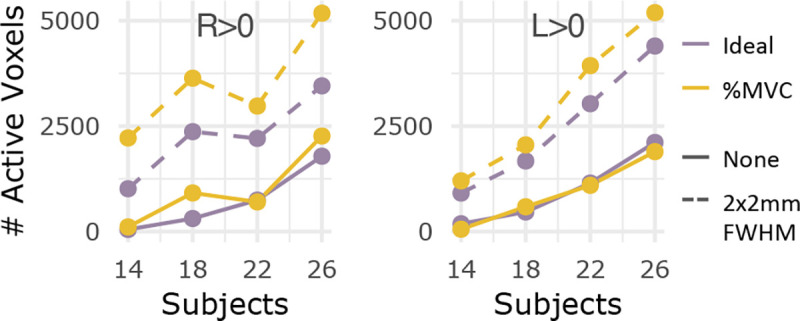
Figure 7. Number of active voxels across sample sizes, with and without smoothing for S1 & S2.

The number of significantly active voxels are plotted for sample sizes N=14, 18, 22, and 26 using both fMRI runs (S1 & S2) without smoothing (solid line) and with smoothing (dashed line). Color indicates which task regressor was used for modeling (Ideal, %MVC). The R>0 and L>0 contrasts are shown here.
