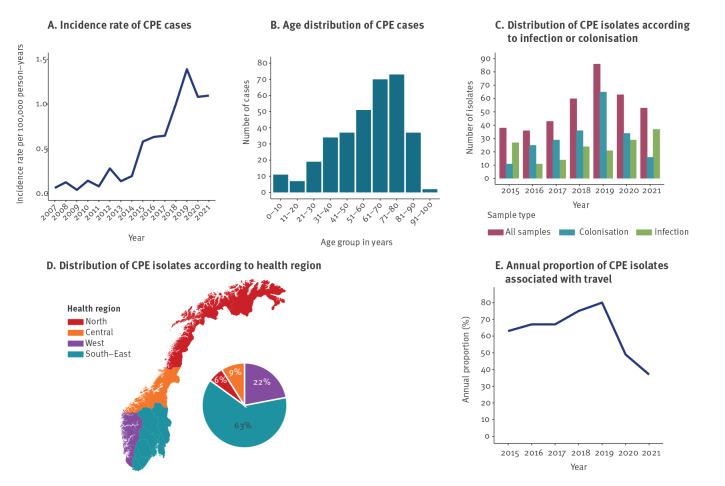
Figure 1.
Distributions of CPE cases’ (A) annual incidence rate per 100,000 person-yearsa and (B) age categories, and distributions of CPE isolates according to (C) infection, colonisation, or (D) health region, as well as (E) annual proportion of CPE isolates associated with travelb, Norway 2015–2021a (n = 332 patients representing 341 cases; n = 389 isolates)
CPE: carbapenemase-producing Enterobacterales.
a For the incidence rate of CPE cases per 100,000 person-years (panel A), the graph also shows previously published data for 2007–2014 [17].
b The denominator for the annual proportions of CPE isolates related to travel are the total number of CPE isolates in each year.

