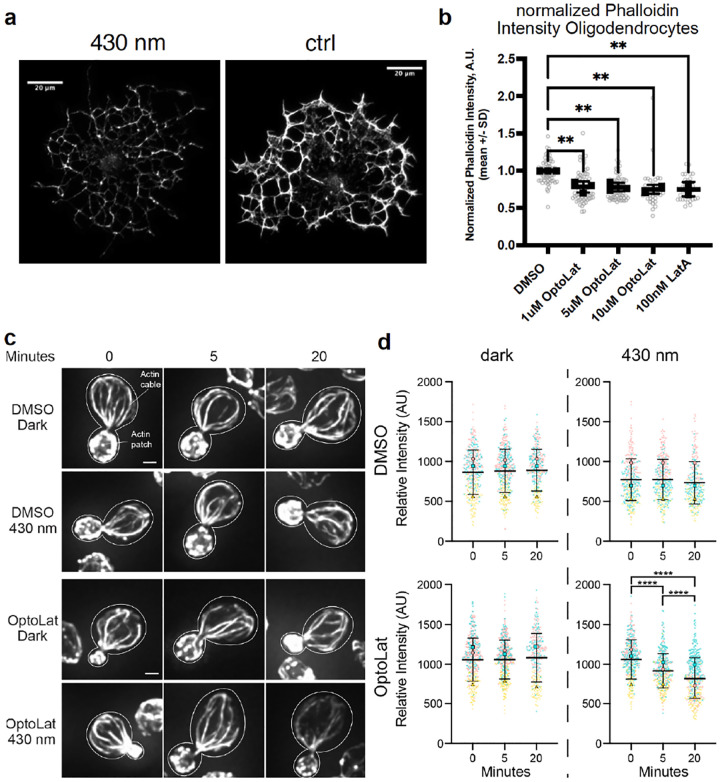
Figure 5:
Light dependent reduction of actin content using OptoLat a) Depletion of F-actin in oligodendrocytes visualized using phalloidin staining after irradiating with 430 nm light b) Quantification of F-actin depletion in oligodendrocytes. ** p ≤ 0.01, values were calculated using one-way ANOVA followed by Dunnett’s multiple comparison test. c) Mid-log phase yeast cells were incubated in the presence of absence of 100 μM OptoLat in the dark or upon exposure to pulsed blue light (430 nm) for 0 – 20 min. Cells were then fixed and stained for F-actin using AlexaFluor488 (AF488)-phalloidin. c) Maximum projections of the actin cytoskeleton in the presence and absence of OptoLat activation. Cell outlines are shown in white. Scale bar: 1 μm. d) Quantitation of AF488-phalloidin-stained F-actin in actin cables. Results are given as the mean ± standard deviation (SD) from 3 independent trials. n > 80 cells/time point/condition/trial. The mean (large symbols) and all datapoints (small symbols) of 3 independent trials are shown, with differently shaped and colored symbols for each trial. Statistical significance was determined by the two-way ANOVA, with Tukey’s multiple comparisons test. **** p ≤ 0.0001.

