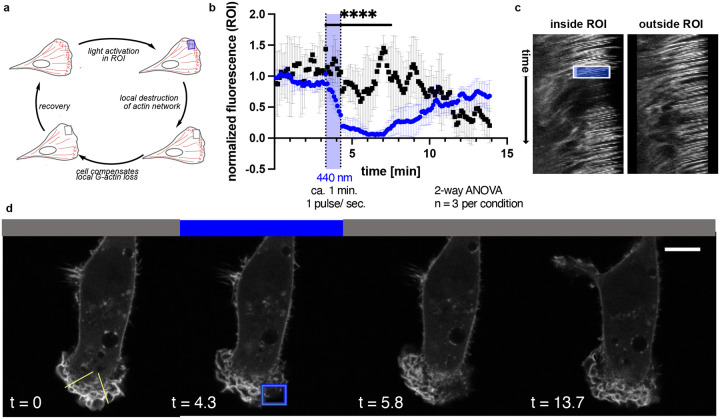
Figure 7:
Cell Migration and local subcellular remodeling of actin networks. a) Schematic of local OptoLat activation, actin network destruction and recovery. ROI = region of irradiation. b) Quantification of fluorescence inside and outside the ROI for n=3 per condition. Black squares = region outside of the ROI; blue circles = within the ROI. c) Kymographs inside and outside of the ROI along the yellow lines in d). The box represents the duration and extent of irradiation in the ROI. d) Time course images of a representative cell treated with OptoLat. Yellow lines in the left panel indicate selections for the kymographs (left: outside of the ROI; right: within the ROI).

