Figure 8:
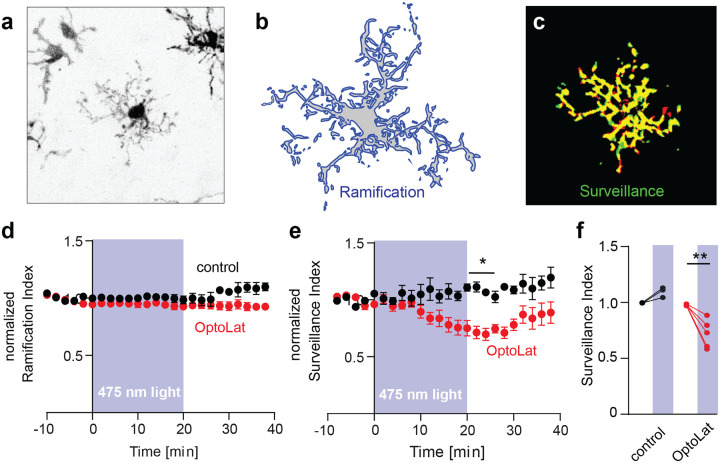
Light-induced reduction of microglia surveillance in brain slice culture. a) Fluorescence image (contrast inverted) of microglia in hippocampal tissue culture expressing tdTomato. b) Ramification of microglia was calculated by dividing its perimeter by the surface area. c) Surveillance was quantified as the sum of areas covered only at one time point (red + green pixels). d) Ramification of microglia was not affected upon activation of OptoLat. Red: Tissue incubated with OptoLat and illuminated for 20 min. Black: Tissue without OptoLat, illuminated for 20 min. Mean ± SEM, normalized to baseline. e) Surveillance index of microglia incubated with OptoLat (red) and without OptoLat (black). Reduction of surveillance after ca 10 minutes irradiation in presence of OptoLat, followed by recovery. Mean ± SEM, normalized to baseline. f) Statistical analysis of light-induced changes in surveillance index in cultures without (control, n = 3 cells/slice cultures) and with OptoLat (n = 5 cells/slice cultures). Baseline (−10 to 0 min) was compared to post-light period (20–22 min). 2-way ANOVA with Bonferroni Post-hoc test. Adjusted p-value: 0.0028.

