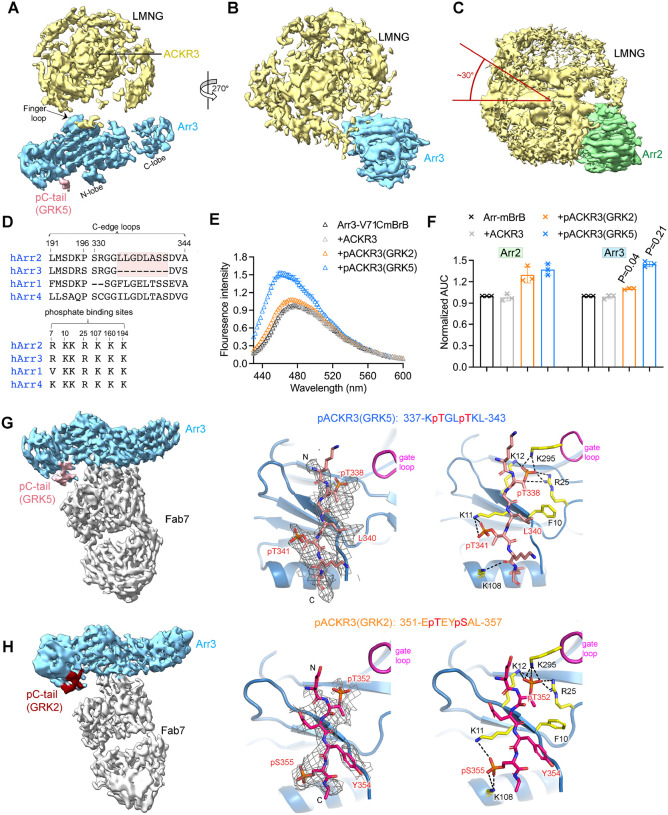
Figure 5. Arr3 binds to ACKR3 in a unique way compared to Arr2, but with similar responses to barcoding by different GRK isoforms.
(A, B) Sharpened map of pACKR3(GRK5)–Arr3 from the pACKR3(GRK5)–Arr3–Fab7 complex with Fab7 omitted. (C) Sharpened map of pACKR3(GRK5)–Arr2 from the pACKR3(GRK5)–Arr2–Fab7 complex with Fab7 omitted. Arr2 is positioned at the same angle as Arr3 in (B) to highlight the ~30° difference in orientation with respect to detergent micelle. (D) Sequence alignment of arrestin C-edge loops and receptor phosphates binding sites. The C-edge loop which is unique in Arr2 is highlighted in pink. (E) Fluorescence spectra of Arr3-V71CmBrB alone (black), or in the presence of non-phosphorylated ACKR3 (grey), pACKR3(GRK2) (orange) or pACKR3(GRK5) (blue). Error bars represent S.D. from three technical replicates. (F) Area under curve (AUC) value from the data in 4B and 5C normalized to Arr2 and Arr3, respectively, allows a direct comparison between Arr2 and Arr3. The AUC value obtained in the presence of GRK2 or GRK5 phosphorylated ACKR3 was compared between Arr2 and Arr3 using t test and p value is shown. (G) Sharpened map of pACKR3(GRK5)–Arr3–Fab7. Interactions of the ACKR3 C-tail phosphorylated by GRK5 with the Arr3 N-lobe in the pACKR3(GRK5)–Arr3–Fab7 complex. Electron density of the pACKR3(GRK5) phospho-peptide is shown as a wire cage contoured at 10σ. Distances below 4Å are shown as black dash line. (H) Sharpened map of pACKR3(GRK2)–Arr3–Fab7. Interactions of the ACKR3 C-tail phosphorylated by GRK5 with the Arr3 N-lobe in the pACKR3(GRK2)–Arr3–Fab7 complex. Electron density of the pACKR3(GRK2) phospho-peptide is shown as a wire cage contoured at 12σ. Distances below 4 Å are shown as black dash line.

