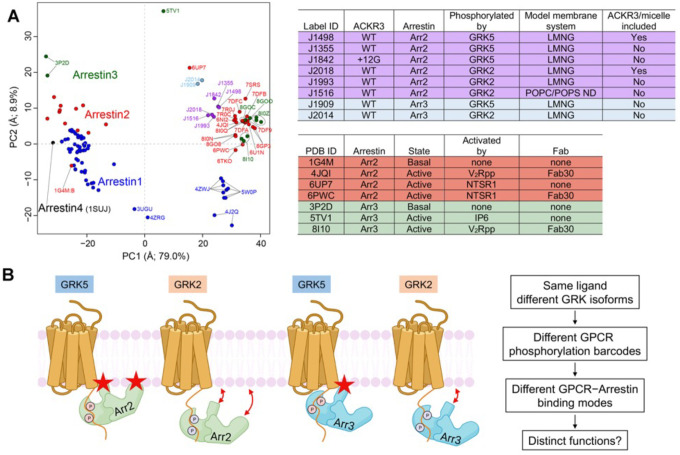
Figure 6. PCA reveals the conformational landscape of arrestins and their complexes with ACKR3.
(A) Conformational map derived from all previously deposited arrestin structures with new structures of arrestin–Fab7 complexes from this paper (light blue and purple circles) superposed. Blue, red, green, and black circles otherwise correspond to structures that include Arr1, Arr2, Arr3, and Arr4, respectively. Structures with Fab7 (light blue and purple circles) or Fab30 (red and green and PC1>15, on right) fall in distinct clusters. Detailed information on the models used for PCA is provided in Table S2. The PC1 axis corresponds to the well-established twist between the N- and C-lobes of arrestin characteristic of activation (Movie S1), whereas the PC2 axis corresponds to an activation-independent “wag” of the C-lobe relative to the N-lobe (Movie S2). The “ACKR3/micelle included” column refers to whether the solubilized receptor was included in the reconstruction (i.e., nanodisc (ND) or LMNG micelle). (B) The distinct configurations of ACKR3–arrestin complexes mediated by different GRK barcodes and different arrestin isoforms identified in this paper may be generally applicable to other 7TM receptors and trigger distinct cellular outcomes. Stars indicate the position of the finger and C-edge loops (Arr2 only) as they engage the membrane. The GRK2 barcode in the C tail of ACKR3 is further from the receptor core than that of GRK5, yielding in our experiments a larger proportion of “tail-mode” complexes. In the case of ACKR3, its 100% bias towards arrestin seems to be entirely driven by GRK phosphorylation and not receptor interactions with arrestin.

