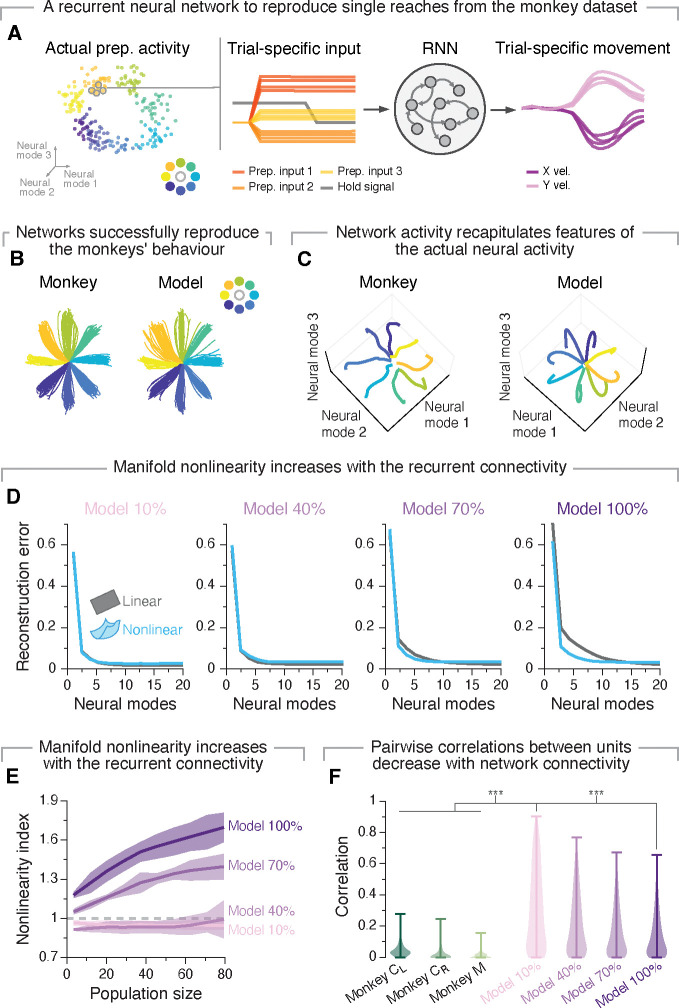
Figure 5: A recurrent neural network model supports the relationship between circuit connectivity and manifold nonlinearity.
A. We trained recurrent neural network models to generate the actual hand velocities generated by the monkeys using trial-specific preparatory activity as inputs. B. These models reproduced the variability across reaches to the same target observed experimentally. C. The latent dynamics of the network activity recapitulated the structure of the monkey latent dynamics (systematic quantifications in Figure S7). Individual traces, trial averaged activity for each target. D. Reconstruction error after fitting flat (grey) and nonlinear (blue) manifolds with increasing dimensionality. Data for example networks with increasing degrees of recurrent connectivity (10%, 40%, 70% and 100%). E. Nonlinearity index indicating the ratio of the estimated dimensionality of nonlinear manifolds to that of flat manifolds as function of the number of sampled units. We compare results for networks with increasing degrees of recurrent connectivity (legend). Values greater than one (dashed grey line) indicate that nonlinear manifolds capture the data better than flat manifolds. Lines and shaded areas, mean±s.d. across 15 repetitions for each of the 10 seeds. F. Strength of pairwise correlations between units from networks with different degrees of recurrent connectivity, compared to the actual monkey data. Violin, probability density for each network connectivity and monkey level. ***P < 0.001, two-sided Wilcoxon rank-sum test.

