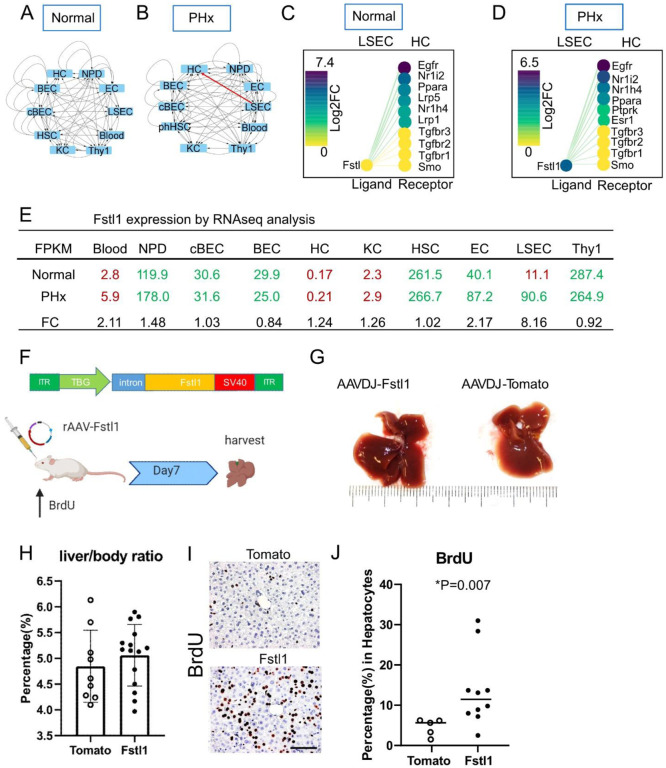
Figure 2. Fstl1 overexpression promotes hepatocyte proliferation.
(A-B) Cytoscape network visualization of Fstl1 as a ligand in 10 different cell types from the normal (A) and PHx (B) liver. Arrows indicate the paracrine and autocrine signal pathways. Red arrow indicates the paracrine signal pathway appears in the PHx but not in the normal liver.
(C-D) The CCInx database showed Fstl1 as a ligand in LSEC and its top 10 receptors in HC. Fstl1 is off (yellow circle) (C) in the normal liver, but upregulated and on (dark purple circle) after partial hepatectomy (D). log2 FC: log2 fold change.
(E) Normalized gene expression of Fstl1 (Tag counts in FPKM) in 10 different cell types from normal liver and PHx. Tag counts in red color: the Fstl1 gene is “off”; Tag counts in green color: the Fstl1 gene is “on”. FC: fold change.
(F) rAAV construct for overexpressing the Fstl1 gene. The Fstl1 gene was cloned into a AAV2 vector backbone with the human thyroid hormone-binding globulin (TBG) as promoter. 2×10¹¹ vector genomes of AAV-Fstl1 virus were injected into C57BL/6 mice fed with BrdU in the drinking water. The liver was harvested on day 7 after injection.
(G) Representative morphology of mouse liver after Fstl1 overexpression. A liver transduced with an AAVDJ-Tomato vector was used as control.
(H) Liver/body weight ratio of independent mice treated with AAVDJ-Tomato (n = 9) and AAVDJ-Fstl1 (n = 15). Student’s t test. P > 0.05
(I) Histology of anti-BrdU staining in the control (Tomato) and Fstl1 overexpression liver. Scale bar = 50 μm. BrdU expressing nuclei stained brown.
(J) Percentage of BrdU+ hepatocytes from Fstl1 overexpression (n = 10) and mock (Tomato) (n= 5) transduced mouse liver. Student’s t test. *P = 0.007 LSEC: liver sinusoidal endothelial cells. HC: hepatocytes

