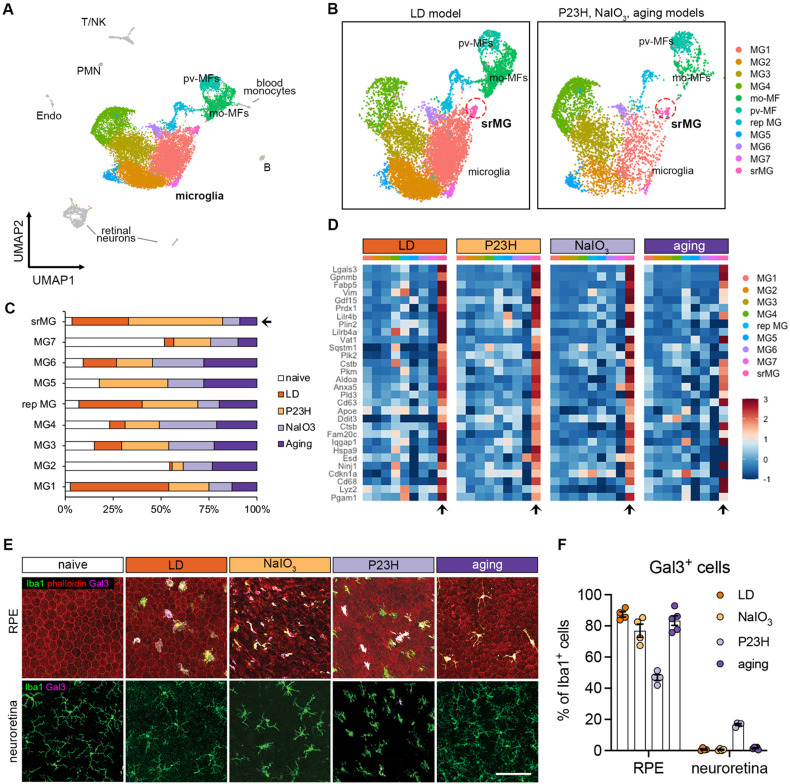
Fig. 1. The microglial population present in the subretinal space shares a common signature in mouse models of photoreceptor degeneration, RPE degeneration, and advanced aging.
(A) UMAP plot showing integrated clustering of immune cells samples from four mouse models of retinal degeneration, including LD model (sorted by Cx3cr1+), NaIO3 model (CD45+), P23H model (CD45+) and aging model (CD45+) and naïve mice (CD45+). A total of 15,623 macrophages, including 13,489 microglia, were integrated among four models. PMN, polymorphonuclear neutrophils; mo-MFs, monocyte-derived macrophages; pv-MFs: perivascular macrophages; NK, natural killer. (B) UMAP plots showing integrated macrophage clusters by two datasets. Dash circles indicate subretinal microglia (srMG). (C) Percentage of sample distribution by clusters. The arrow indicates the enrichment of srMG cluster from degenerating retinas. (D) Heatmap of top 30 conserved marker genes of subretinal microglia shared by each model across clusters. Genes were ranked by fold changes. Arrows indicate srMG cluster. (E) In situ validation of Gal3 expression on the apical RPE (top) or in the neuroretina from the inner plexiform layer (bottom). Iba1 (green), phalloidin (red, only in RPE) and Gal3 (magenta). Scale bar: 100μm. (F) Percentage of Gal3+ cells relative to Iba1+ cells between RPE and neuroretina tissues across models.

