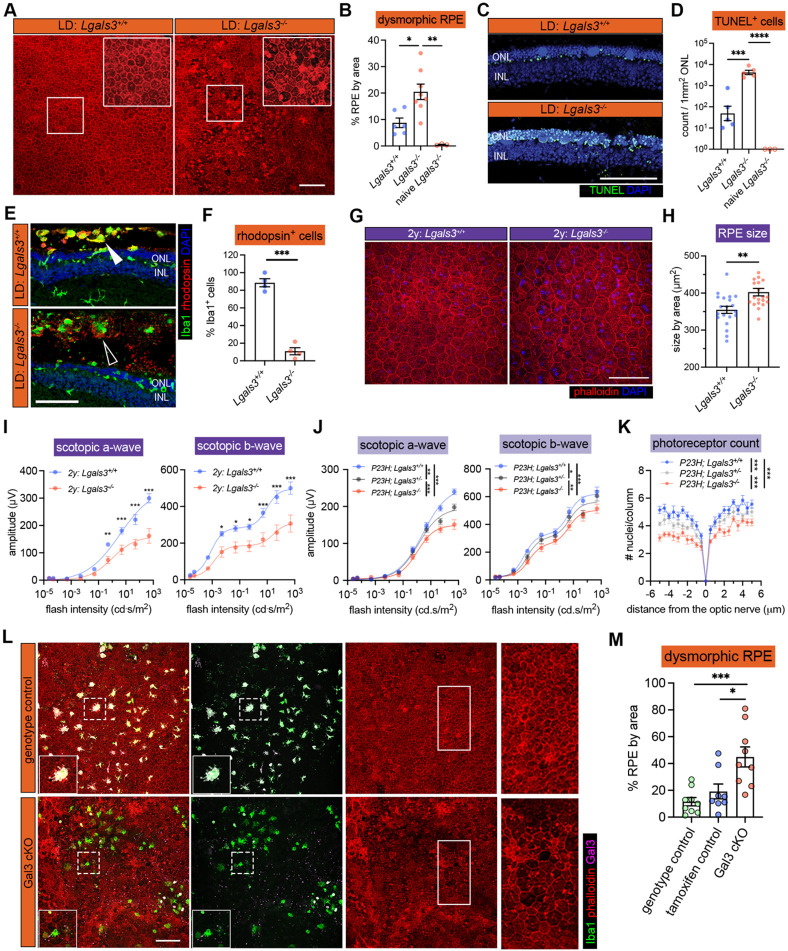
Fig. 2. Galectin-3 expressed by subretinal microglia is central in restricting disease progression in acute, genetic, and aging mouse models of retinal degeneration.
(A) Images of phalloidin staining in WT and Lgal3−/− RPE tissues in LD. (B) Quantifications of dysmorphic RPE cells (n=6, 7 and 3, respectively). (C) TUNEL (green) and DAPI (blue) staining in WT and Lgal3−/− retinal cross sections in LD. ONL and INL, outer and inner nuclear layers. (D) Quantifications of TUNEL+ photoreceptors in ONL (n=5, 5 and 3, respectively). (E) Rhodopsin (red) and Iba1 (green) staining in WT and Lgal3−/− retinal cross sections in LD. Images from single planes of confocal scans were shown. (F) Quantifications of rhodopsin+ subretinal microglia (n=4 per group). (G) Images of phalloidin staining in WT and Lgal3−/− RPE tissues at 2 years of age. (H) Quantifications of RPE cell size. Dots represent individual images with n=5 mice per group. (I) ERG data showing scotopic a- and b-waves in 2-year-old WT (n=5) and Lgal3−/− (n=5) mice. (J) Scotopic a- and b-waves of ERG data among Lgal3+/+ (n=12), Lgal3+/− (n=6) and Lgal3−/− (n=10) in P23H mice. (K) Quantifications of ONL thickness among Lgal3+/+ (n=7), Lgal3+/− (n=7), and Lgal3−/− (n=8) in P23H mice. (L) Representative images of dysmorphic RPE cells in Gal3 cKO in LD. Iba1, green; phalloidin, red; Gal3, magenta. (M) Quantifications of dysmorphic RPE cells in Gal3 cKO mice (n=9) compared with genotype control (Cx3cr1CreER/+Lgals3fl/fl mice, n=9) and tamoxifen control (Cx3cr1CreER/+ mice treated with tamoxifen, n=8). Scale bars: 100μm. Data were collected from 2-3 independent experiments. *: p<0.05; **: p<0.01; ***: p<0.001. One-way ANOVA with Tukey’s post hoc test (B, D and M); unpaired Student’s t-test (F and H); two-way ANOVA with Tukey’s post hoc test (I, J and K).

