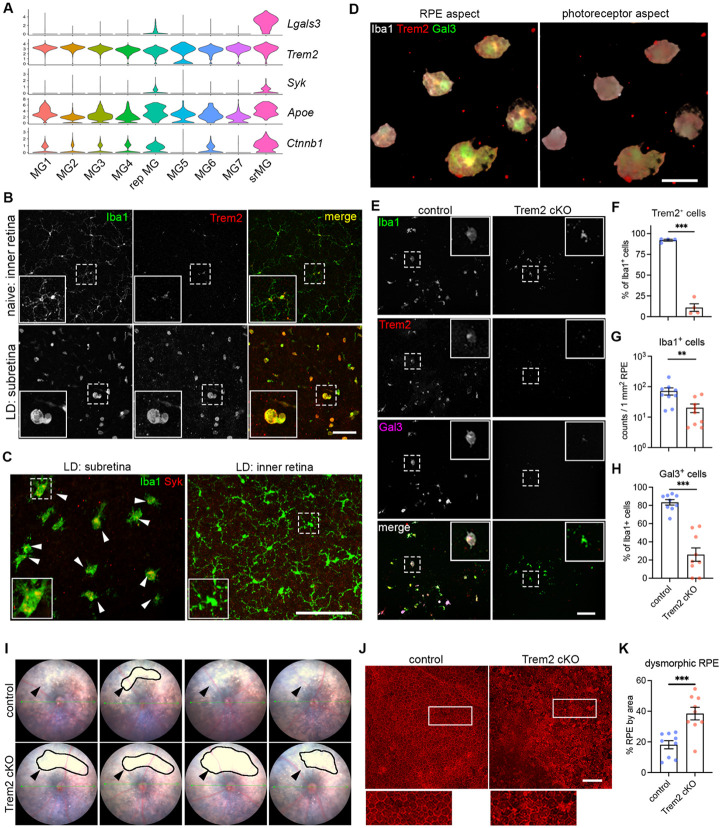
Fig. 3. Trem2 regulates microglial migration and promotes galectin-3-mediated protection.
(A) Violin plots showing the upregulation of genes (Lgals3, Syk and Ctnnb1I) related to Trem2 signaling by subretinal microglia from the integrated dataset of all four mouse models. (B) Images of Iba1 (green) and Trem2 (red) staining in naïve microglia from inner retina and subretinal microglia in LD. (C) Images of Iba1 (green) and Syk (red) staining in subretinal microglia and microglia from inner retina in LD. (D) 3D rendering images of Gal3 (green), Trem2 (red) and Iba1 (white) staining in subretinal microglia in LD. Views from both the apical RPE aspect and neuroretina aspect are shown. (E) Images of Iba1 (green), Trem2 (red) and Gal3 (magenta) staining in subretinal microglia between control and Trem2 cKO mice in LD. (F-H) Quantifications of Trem2 depletion (F, n=4 per group), Iba1+ cells (G, n=9) and Gal3+ cells (H, n=9) between control and Trem2 cKO mice. (I) Fundus images showing increased subretinal white lesions in of Trem2 cKO mice in LD as indicated by arrows. Images from four individual mice per group are shown. (J) Images of phalloidin staining in RPE tissues from control and Trem2 cKO mice in LD. (K) Quantifications of dysmorphic RPE cells between control and Trem2 cKO mice (n=9 per group). Scale bars: 50μm (D); 100μm (B, C E,and J). Data were collected from 2 independent experiments. **: p<0.01; ***: p<0.001. Unpaired Student’s t-test (F-H).

