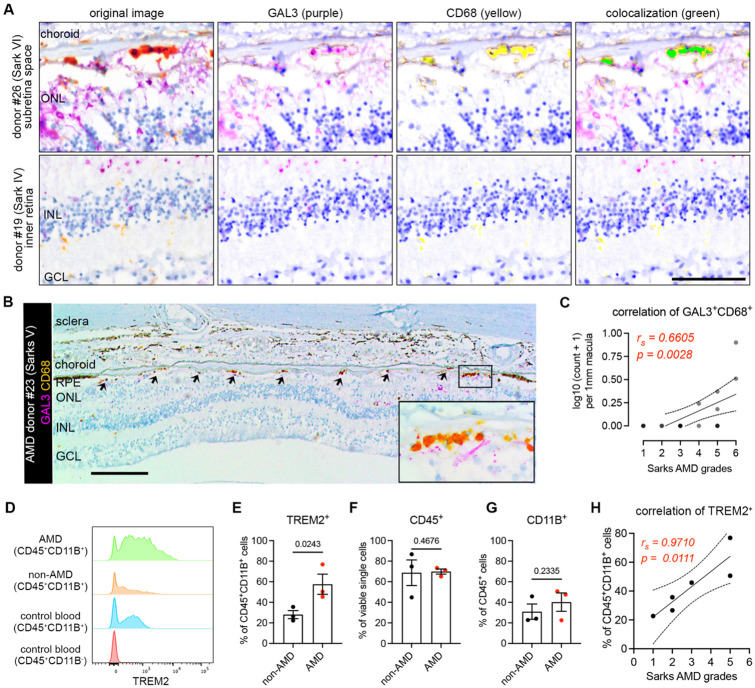
Fig. 6. Microglia expressing galectin-3 and TREM2 are associated with AMD progression.
(A) Multispectral imaging of GAL3 and CD68 co-staining in the subretinal space (top) and inner retina (bottom) from human donors. Unmixed purple spectrum (GAL3) and yellow spectrum (CD68) are shown. The areas of colocalized spectra are highlighted in green. Scale bar: 50μm. ONL and INL, outer and inner nuclear layers. (B) Representative image of Gal3 and CD68 co-staining in the macular GA region of a retinal section from an 88-year-old female donor eye with advanced AMD (Sarks V). Black insert box shows the magnification of GA with double positive cells. Scale bar: 200μm. ONL and INL, outer and inner nuclear layers; GCL, ganglion cell layer. (C) Correlation between the frequencies of macular Gal3+CD68+ double positive cells (y axis) and Sarks AMD grading (x axis) by Spearman’s correlation (n = 18 donors, Table S2). Coefficient and p-value are shown. (D) Histograms showing increased TREM2+ myeloid cells (CD45+CD11B+) in RPE/choroid tissues of AMD donors. Concatenated histograms were shown (n=3 per groups). Control human blood samples were used to set up flow gating. (E-G) Quantifications of TREM2+ (E), CD45+ (F), and CD11B+ (G) cell frequencies in RPE/choroid tissues between non-AMD and AMD donors. Unpaired Student’s t test is used. P-values are shown. (H) Correlation between the frequencies of TREM2+ myeloid cells (y axis) and Sarks AMD grading (x axis) in RPE/choroid tissues by Spearman’s correlation. Coefficient and p-value are shown.

