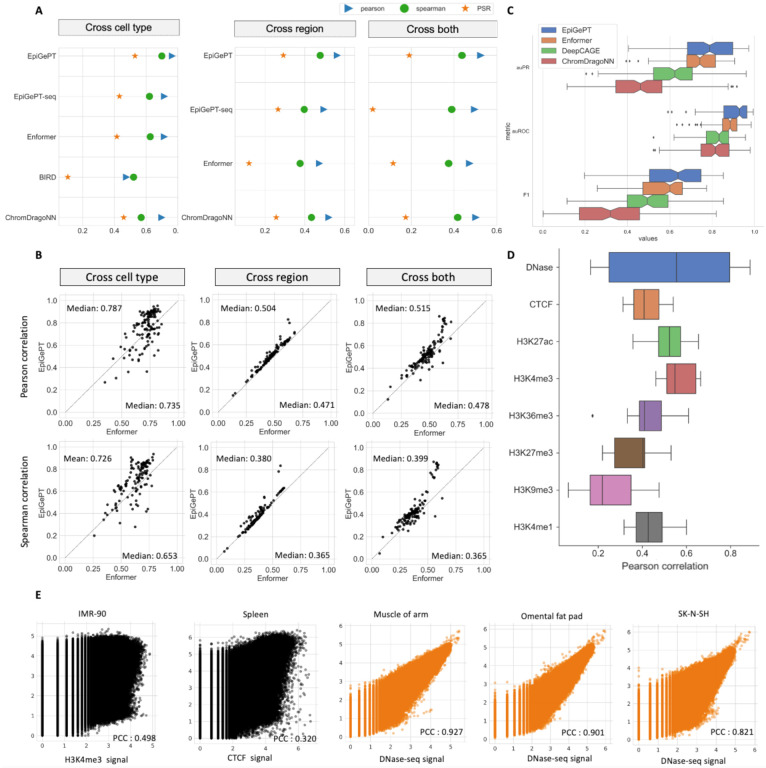
Fig. 2. Performance of EpiGePT and baseline methods on the benchmark experiment.
(A) EpiGePT and baseline methods were compared in terms of their regression performance for DNase signal regression across cell types, genomic regions, and combined cell type and genomic regions. (B) Comparison of EpiGePT and Enformer performance. Each point in the scatter plot represents the performance of Enformer on the data of a specific cell type (x-axis) compared to the performance of EpiGePT (y-axis). (C) EpiGePT and baseline methods’ performance on binary prediction of DNase-seq signals. (D) EpiGePT demonstrates excellent performance in predicting diverse epigenetic signals across various cell types, including DNase-seq, CTCF, and histone modifications. (E) EpiGePT predictions compared to experimental signals visualized for a representative example. Genome-wide multi-signal predictions (black) and DNase-specific predictions (orange).

