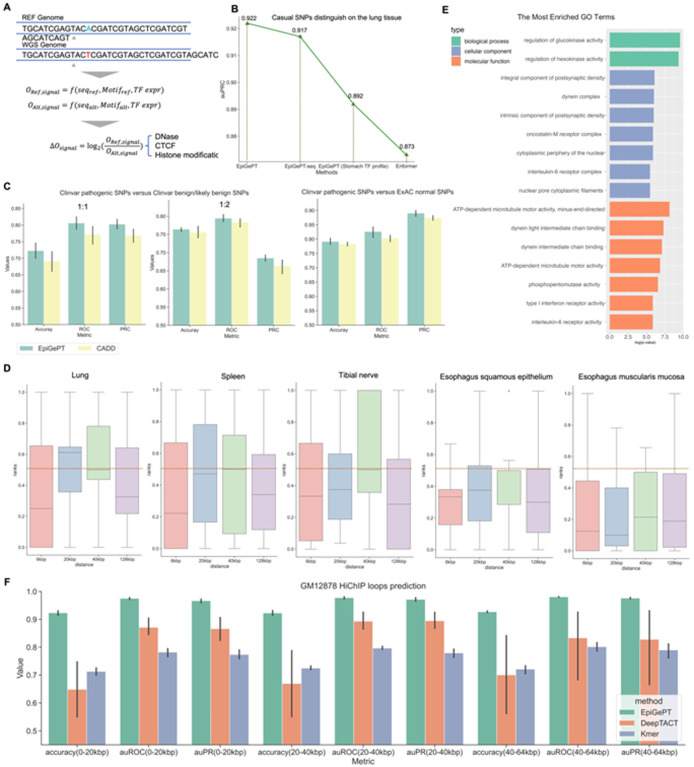
Fig. 4. Variant effect prediction of EpiGePT.
(A) The LOS score for each epigenomic signal is calculated by the log change fold of the predicted epigenomic signal for reference genome and WGS genome. (B) The performance of EpiGePT and Enformer in discriminating causal SNPs on the Lung tissue. (C) The three subplots from left to right respectively depict the classification results for disease-related SNPs and benign SNPs down-sampled sourced from the ClinVar database, with balanced positive and negative samples (1:1 and 1:2 ratio), as well as normal SNPs sourced from the ExAC database with a MLP classifier. (D) The ranked position of COVID-19 related GWAS data among surrounding benign SNPs based on their LOS scores, as determined using different tissue or cell-type expression data. The results were stratified based on the distance range of the risk region. The resulting mean and median ranks were both below 0.5. (E) Enrichment result (Biological process, Cellular component and Molecular function) of the nearest genes of the COVID-19 associated SNPs with the max LOS scores. (F) The performance (auROC and auPRC) of the fine-tuned EpiGePT model and baseline methods (DeepTACT and Kmer) in distinguishing enhancer-gene pairs at various distance ranges (0–20 kbp, 20–40 kbp and 40–64 kbp) on K562 cell line.

