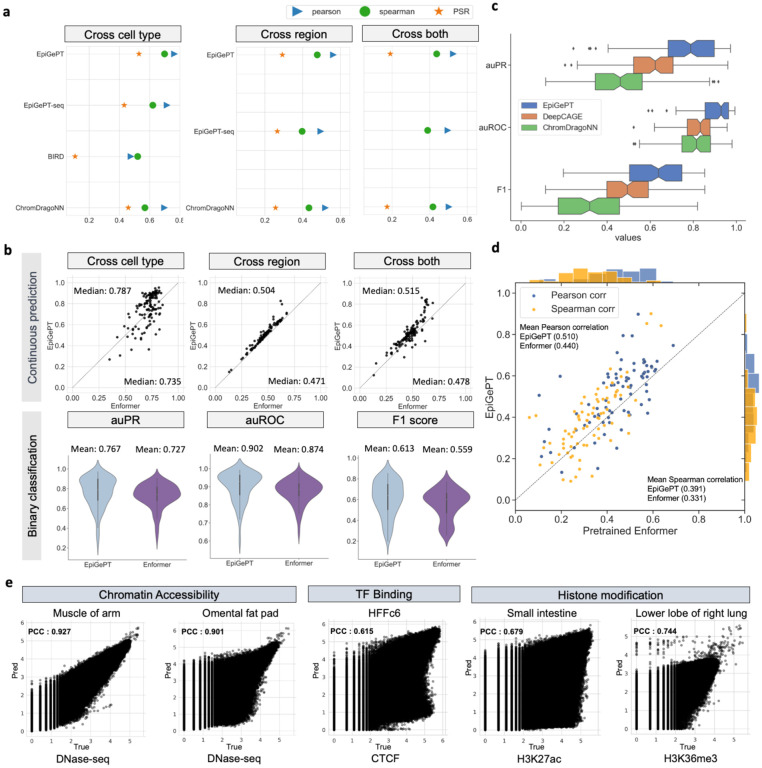
Fig. 2. Performance of EpiGePT and baseline methods on the benchmark experiment.
a, EpiGePT and baseline methods were compared in terms of their regression performance for DNase signal regression across cell types, genomic regions, and combined cell type and genomic regions. b, Comparison of EpiGePT and Enformer performance. Each point in the scatter plot represents the performance of Enformer on the data of a specific cell type (x-axis) compared to the performance of EpiGePT (y-axis). The top three graphs represent the prediction of continuous DNase signals (pearson correlation coefficient), while the bottom three graphs represent the binary classification of chromatin accessibility regions. c, EpiGePT and baseline methods’ performance on binary prediction of DNase-seq signals. d, EpiGePT demonstrates more excellent performance in predicting diverse epigenetic signals across various cell types, compared with the pre-trained Enformer on 78 genomic tracks across 19 unseen cell types. The orange points represent Spearman correlation coefficient, and the blue points represent pearson correlation coefficient. e, EpiGePT cross-cell-type predictions compared to experimental signals visualized for a representative example. The predictions specific to DNase are based on the hg19 reference genome, while predictions for multiple epigenomic profiles are conducted using the hg38 reference genome.

