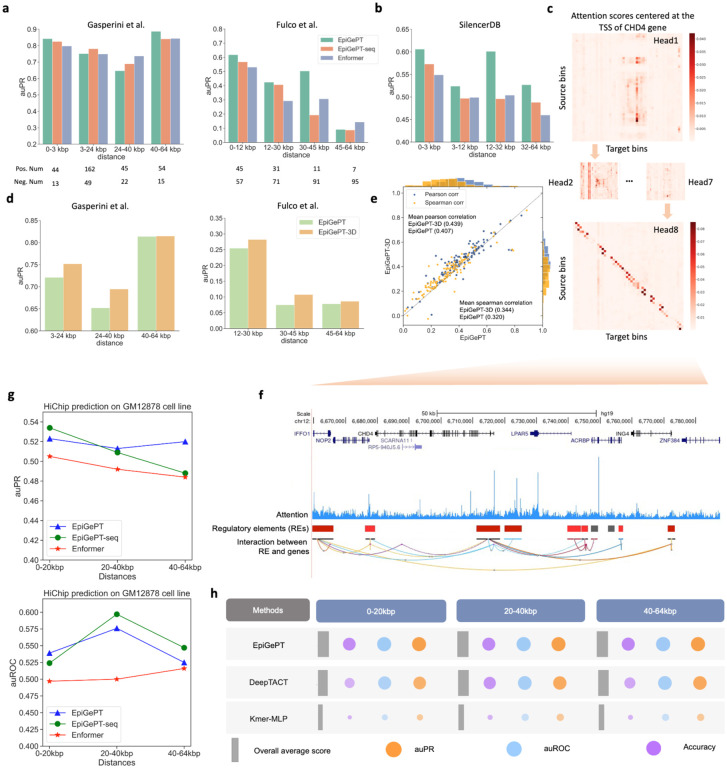
Fig. 3. Application of self-attention mechanism in EpiGePT for long-range chromatin interaction identification.
a, The performance (auPRC) of attention score of EpiGePT in distinguishing enhancer-gene pairs at different distance ranges on two different datasets. b, The performance (auPRC) of attention score of EpiGePT in distinguishing silencer-gene pairs at different distance ranges based on the data from SilencerDB24. c, Heatmap of the self-attention matrix of each attention head centered at the TSS of the CHD4 gene, the (i, j) element in the matrix denotes the average attention score between the ith genomic bin and the jth genomic bin across all layers. d, The performance (auPR) of self-attention scores of EpiGePT and EpiGePT-3D in identifying enhancer-promoter interactions across different distance ranges on the K562 cell type. e, The predictive performance (blue points denote pearson correlation coefficients and orange points denote spearman correlation coefficients) of EpiGePT with knowledge guidance across 19 cell types and 15,870 long sequences (128kbp). f, Attention scores centered at the TSS of the CHD4 gene, and putative enhancer regions in its vicinity. g, The performance (auROC and auPR) of attention score of EpiGePT in distinguishing HiChIP loops of H3K27ac at different distance ranges on GM12878 cell line. h, The performance (auROC and auPRC) of the fine-tuned EpiGePT model and baseline methods (DeepTACT and Kmer) in distinguishing enhancer-gene pairs at various distance ranges (0–20 kbp, 20–40 kbp and 40–64 kbp) on K562 cell line under a 5-fold cross validation setting. The size of the bubbles in the plot represents the magnitude of the metric values, while the width of the gray rectangles along the x-axis signifies the overall average values of the three metrics.

