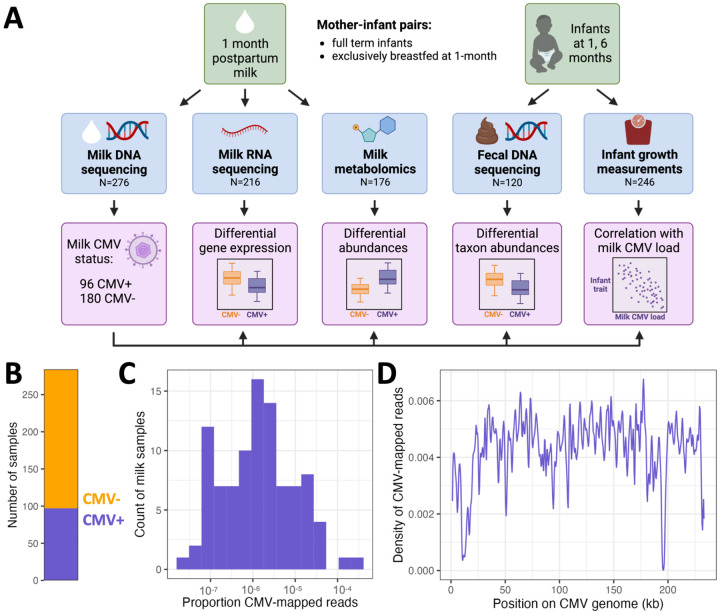
Figure 1.
(A) Study overview. (B) Count of milk samples identified as CMV+ (N=97, purple) or CMV− (N=187, orange). (C) The distribution of CMV-mapped DNA reads, as a proportion of all DNA reads, across milk samples that had at least one read mapped to the CMV genome. (D) Density of CMV-aligned reads across the CMV genome from all CMV+ milk samples. The density refers to the fraction of all CMV-mapped reads aligned to a particular region of the CMV genome. The density dips close to zero at repetitive regions in the CMV genome31.

