Figure 3.
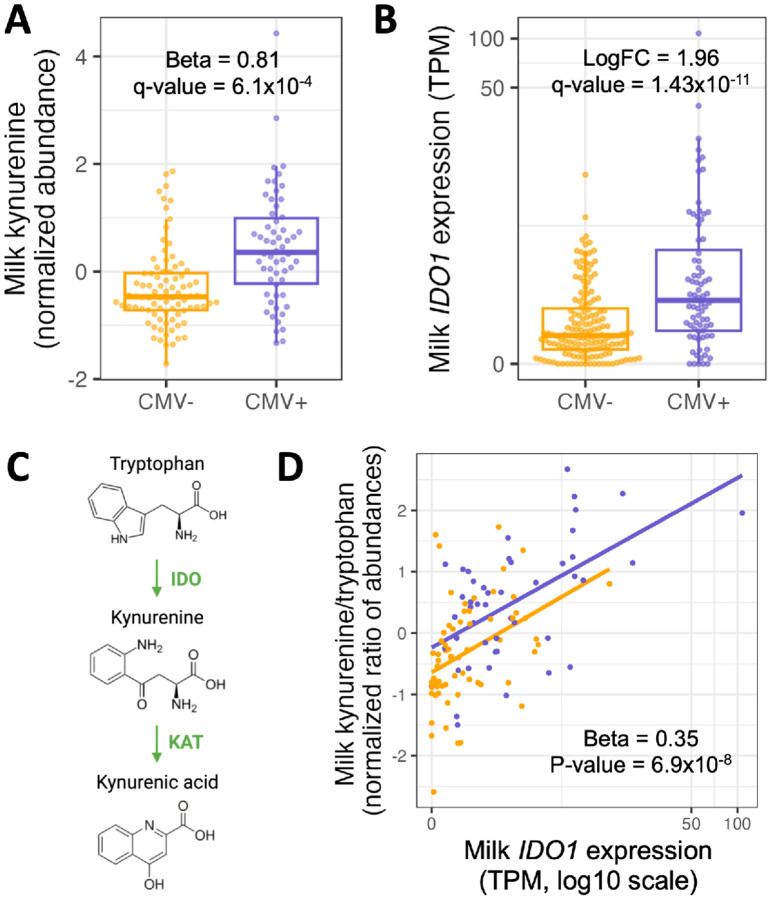
(A) Kynurenine abundances in CMV− (orange) vs. CMV+ (purple) milk samples. Each dot represents a milk sample. Plotted kynurenine levels (y-axis) are residuals after correcting for covariates included in the differential abundance analysis (see Methods). (B) IDO1 expression in CMV− (orange) vs. CMV+ (purple) milk samples. Each dot represents a milk sample. LogFC: log fold-change between CMV+ and CMV− samples. (C) IDO1 encodes the enzyme indoleamine 2,3-dioxygenase (IDO), which performs the rate-limiting step converting tryptophan to kynurenine. Kynurenic acid is metabolized from kynurenine by the KAT enzyme. (D) Correlation between IDO1 expression (x-axis) and the ratio of kynurenine and tryptophan abundances (y-axis) in milk samples, stratified by CMV status. Each dot represents a milk sample.

