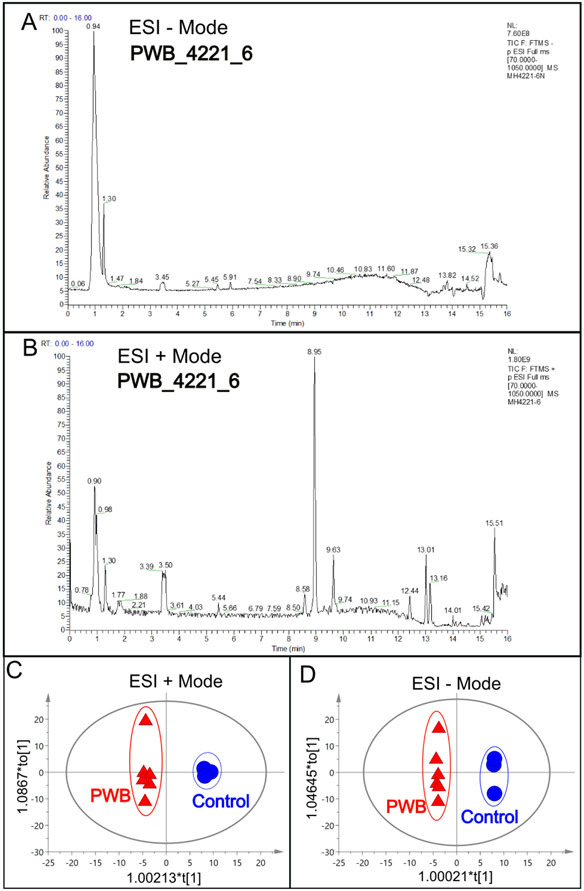
Fig 1.

An example of total ions chromatogram (TIC) representing the summed intensity with all detected mass spectral peaks associated with metabolites. A, TIC from the PWB_4221_6 iPSC line in ESI− mode; B, TIC from the same iPSC line in ESI+ mode; C, OPLS-DA model showing scattering scores and cluster tendencies among all samples in ESI + mode; D, OPLS-DA model showing scattering scores and cluster tendencies among all samples in ESI − mode. Digits on the X or Y axis are eigenvalues of regression coefficient for the predictive principal component (X) or the orthogonal component (Y), respectively.
