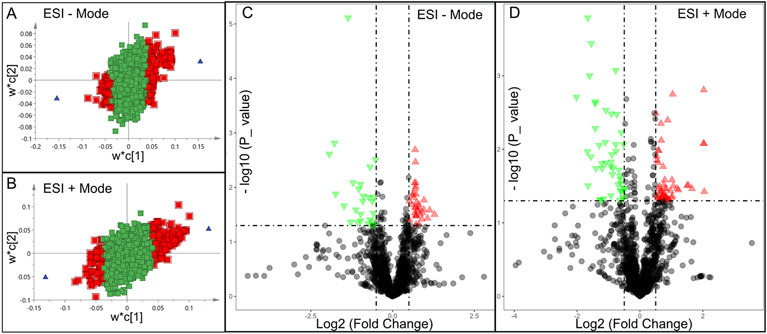
Fig 2.

Discovery of differential metabolites (DMs) by multivariate analysis. A and B, distribution of significant metabolites detected in ESI − (A) and ESI + (B) modes using a PLS-DA model resulting in coefficients for the variables in a w*c loading plot. w, PLS-weights for the X-variables; c, PLS-weights for the Y-variables; Red box, metabolites with VIP > 1.5; green box: metabolites with VIP < 1.5; C and D, volcano plots showing clusters of DMs detected in ESI − (C) and ESI + (D) modes. Blue triangle, significantly downregulated metabolites; red triangle: significantly upregulated metabolites; black circle: insignificant metabolites; vertical dash lines: log2 (fold change) = ± 0.5; horizontal dash line: p value = 0.05.
