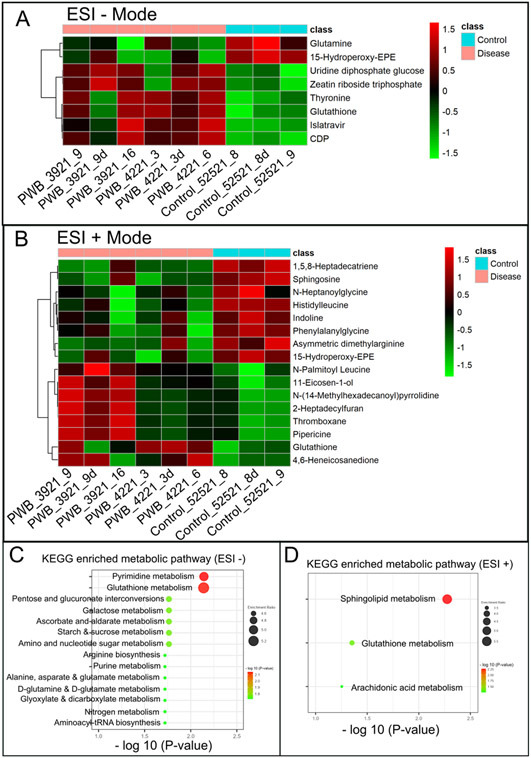
Fig 4.

Hierarchical cluster analysis (HCA) and KEGG pathway enrichment of metabolome data. A & B, the heatmap of significantly DMs identified in ESI − (A) and ESI + mode (B) in PWB iPSCs as compared to the control ones; HCA was performed using the complete linkage algorithm of the program Cluster 3.0 and the results are visualized using Pheatmap 1.0.12 (Raivo Kolde). C & D, enriched KEGG pathways related to the perturbed metabolic networks involving DMs identified in ESI − (C) and ESI + mode (D); the enriched metabolic pathways are indicated by color (−log10 (P value)) and size (black ball, enrichment ratio). PWB_3921_9d, PWB_4221_3d, and Control_52521_8d were experimental duplications of PWB_3921_9, PWB_4221_3, and Control_52521_8, respectively.
