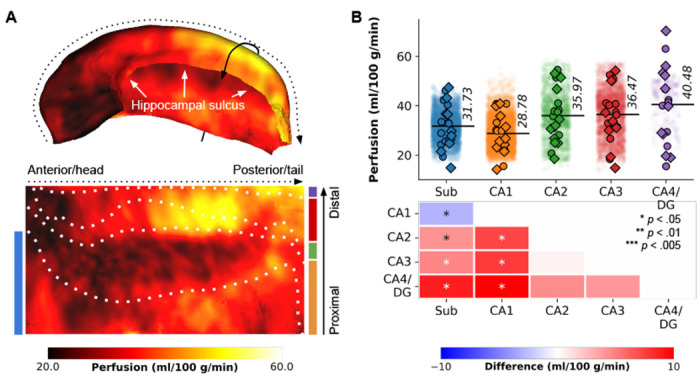
Figure 1.

Perfusion mapping in the hippocampus. (A) The figure displays perfusion values (ml/100 g/min) mapped on folded and unfolded hippocampal surfaces. The dotted and solid arrows indicate the anterior-posterior and proximal-distal axes, respectively. Subfield boundaries, derived from cytoarchitectonic features of the BigBrain atlas, are overlaid on the unfolded map. (B) Subfield averages, color-coded based on the subfield atlas overlaid on maps in D, are presented for each subject and hemisphere (circles for the left hemisphere, diamonds for the right hemisphere), as well as per vertex (semi-transparent dots averaged across subjects and hemispheres). Pairwise comparisons between subfield averages are depicted as heatmaps, with FDRBH-corrected p-values indicated by asterisks: *p < .05, **p < .01, ***p < .005.
