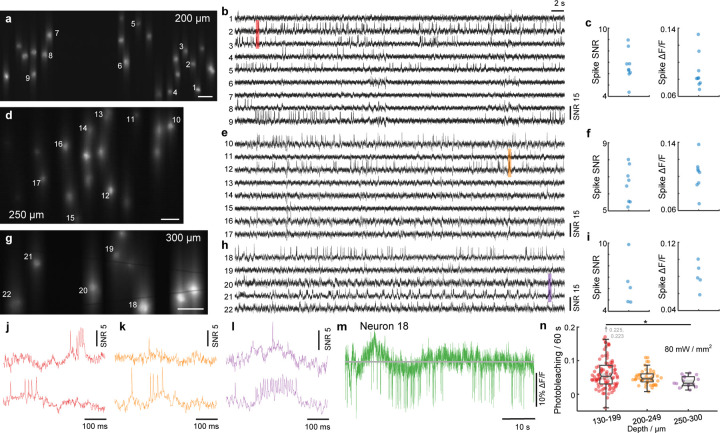
Figure 4. TICO microscope enables high SNR voltage imaging at 300 µm depth.
(a-i) Example Voltron2 fluorescence images (a,d,g), voltage traces of spiking neurons (b,e,h), and average spike SNR, ∆F/F (c,f,i) at increasing imaging depths of 200 µm (a-c), 250 µm (d-f), and 300 µm (g-i) below the brain surface. Median spike SNR and ∆F/F are 6.37/0.081, 6.63/0.105, 6.08/0.078 for the active neurons shown in (b,e,h), respectively. See Table S3 for a list of imaging parameters. Scale bars in (a,d,g) are 50 µm.
(j-l) Zoomed-in fluorescence traces from the shaded regions in (b,e,h).
(m) Raw fluorescence trace of neuron 18 over the 1 min recording.
(n) Comparison of photobleaching rate measured at different imaging depths. Excitation power density at the brain surface was kept constant at 80 mW/mm2. The reduction in photobleaching rate with increasing imaging depth is caused by the reduction in excitation power received by the targeted neurons due to tissue scattering. Box plot same as Fig. 2(e). *p < 0.05, Wilcoxon rank sum test, see Table S4 for statistics.

