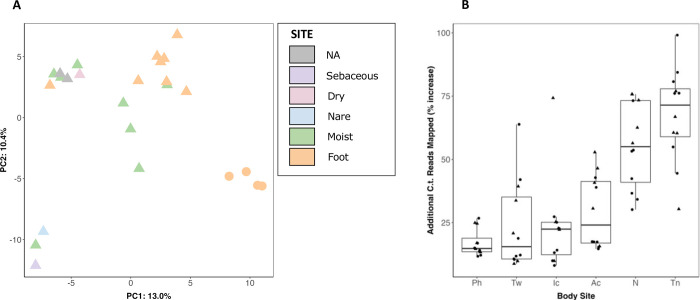
FIG 4.
C. tuberculostearicum complex pangenome clustering and improved metagenomic read mapping. (A) Principal components analysis of orthologous gene clustering. The gene presence/absence data for 25 genomes (including two NCBI references, shown in gray) was analyzed using principal components analysis. Ribotype B genomes are shown as circles; other genomes are triangles. (B) Improvement in shotgun metagenomic read mapping with a 28 member C. tuberculostearicum database as compared to the 5 member NCBI database. Percent increase in mapped C. tuberculostearicum reads by body site. Each point is a healthy volunteer. Triangles mark healthy volunteers that contributed one or more isolates to the expanded mapping database.

