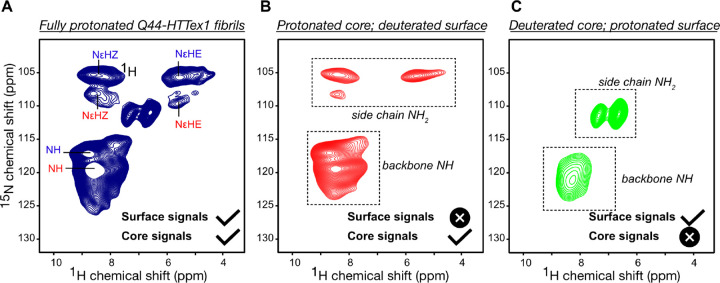
Figure 5. NMR analysis of polyQ core and surface residues based on H–D exchange.
(A) 2D 1Hdetected 1H–15N HETCOR NMR spectrum of fully protonated Q44-HTTex1 fibrils. The peak labels are color-coded based on the conformer type (“a” = red; “b” = blue), corresponding to the amyloid core assignments from Supplementary Fig. S7. Attenuation of peaks from the “a”-conformer side-chains is attributed to different dynamics (see also Supplementary Fig. S15D). (B) Analogous data for surface-deuterated Q44-HTTex1 fibers, which is expected to only show peaks from the fibril core. (C) Analogous 2D spectrum for core-deuterated, surface-detected Q44-HTTex1 fibers, which reveals distinct signals from residues on the polyQ surface. The most dramatic difference is seen for the side chain NH2 group. Measurements at 700 MHz using 60 kHz MAS, at 253 K setpoint temperature. See also Supplementary Fig. S15 for additional data and relaxation measurements.

