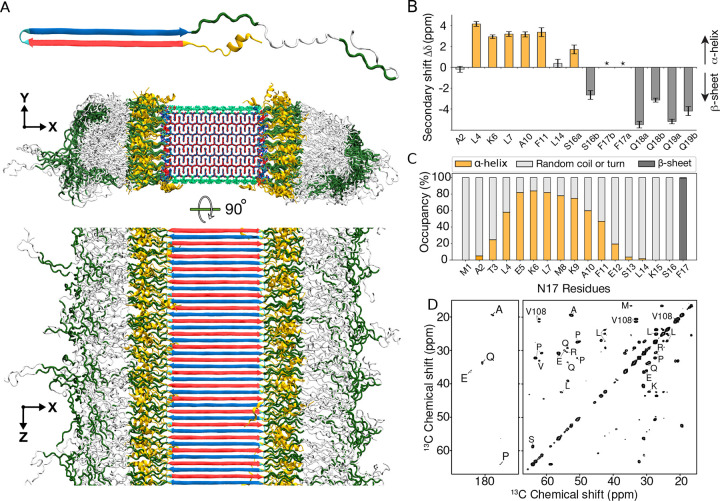
Figure 6. Structure of Q44-HTTex1 amyloid fibril.
(A) Atomic-level structural model for mutant HTTex1 fibril. The top image shows a representative monomer within the fibril, with its β-hairpin polyQ segment to the left and the largely disordered flanking segments to the right. The middle image shows a cross-section, and the bottom image a side view of the fibril. The polyQ core is shown with the conformer-identifying red (for “a”) and blue (for “b”) β-strands, the N-terminal flanking segments yellow, and the C-terminal polyproline II helices dark green. Surface residues of the polyQ amyloid core are light green. (B) Secondary chemical shift values for residues in the N-terminal end, indicating local α-helix (positive values) or β-sheet (negative) conformations, replotted from previously reported work.21 Doubled peaks indicating multiple co-existing conformations are marked with letters a and b. The asterisks mark F17, for which a peak (13Cβ) was not detected, but other resonances indicate β-sheet structure. (C) Secondary structure distribution of the 17 residues in the N-terminal flanking domain during the last 500ns of 5-μs MD simulation (Amber14SB45). (D) A 2D TOBSY ssNMR spectrum of Q44-HTTex1 fibrils, in which observed cross-peaks correspond to highly flexible residues outside the fibril core. Most, but not all, peaks originate from the C-terminal tail of the PRD. Spectrum was acquired at 600MHz at 8.33kHz MAS.

