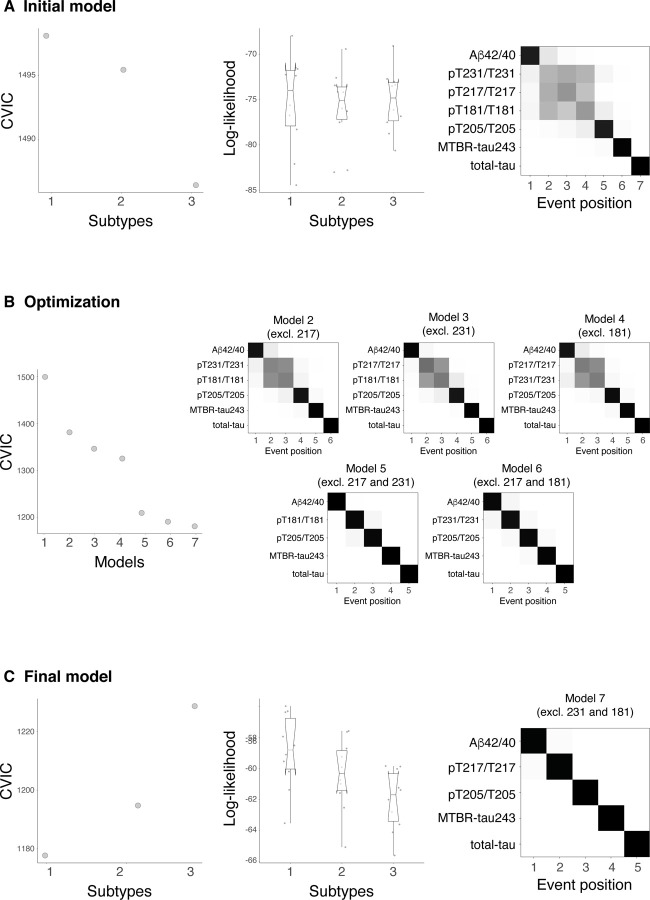
Ext Data Fig 1: Creation and optimization of the model.
Initial model with all CSF biomarkers (Aβ42/40, pT217/T217, pT231/T231, pT181/T181, pT205/T205, MTBR-tau243 and total-tau) is shown in A. First two columns represent the statistics, CVIC and log-likelihood, of this model for one, two and three subtypes. Each dot in log-likelihood plot represents one of the ten cross-validation sets of data. Lower CVIC and higher log-likelihood values represent better performance of the model. Although higher number of subtypes had higher CVIC, the comparable log-likelihood across subtypes suggests that one subtype is complex enough to explain the variability observed in the data. Cross-validated confusion matrix of the one subtype model is shown in the last column. Here, biomarkers are sorted by the time they become abnormal based on the results of SuStaIn. Darkness represents the probability of that biomarker of becoming abnormal at that position, with black being 100%. Given that some biomarkers (pT217/T217, pT231/T231 and pT181/T181) show high overlap on the ordering, we optimized the model by removing these biomarkers systematically (B). All models without one or two of these biomarkers were tested (models 2 to 7). CVIC (left) and cross-validated confusion matrixes (right) for each of these models are shown in B, respectively. CVIC shows that the optimal model was that excluding both pT231/T231 and pT181/T181 (model 7, shown in C). Both CVIC and log-likelihood measures show that one subtype was the optimal model when using this set of biomarkers. Abbreviations: Aβ, amyloid-β; CVIC, cross-validation information criterion; MTBR, microtubule binding region; pT, phosphorylated tau; SuStaIn, subtype and stage inference.

