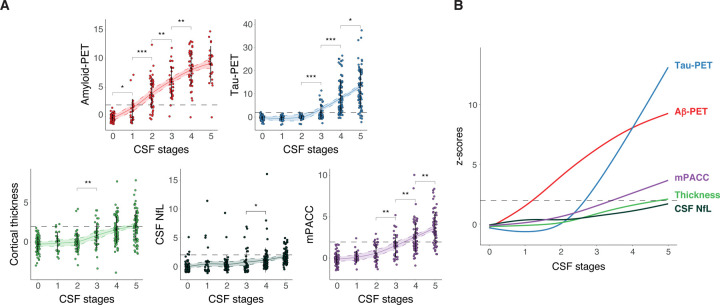
Fig 2: AD pathology, biomarkers and cognition by CSF stages.
Depiction of individual biomarker levels, not used in the creation of the model, by CSF stage in BioFINDER-2 participants (A). These include biomarkers of amyloid (amyloid-PET) and tau (tau-PET in the meta-temporal ROI) pathologies, neurodegeneration (cortical thickness in the AD signature areas and CSF NfL) and cognition (mPACC). Biomarkers are z-scored based on a group of CU− participants (n=63) and all increases represent increase in abnormality. Significant differences in contiguous CSF stages are shown with asterisks. Horizontal line is drawn at z-score=1.96 which represents 95%CI of the reference group (CU−). Smoothed LOESS lines of all AD biomarkers are shown in B for comparison. All participants with available data were included in amyloid- and tau-PET analyses. For neurodegeneration (cortical thickness and NfL) and cognitive (mPACC) measures, we excluded non-AD dementia patients to avoid bias. Of note, only few AD dementia cases had amyloid-PET available due to study design. CSF stage 0 represent being classified as normal by the model. Black dots and vertical lines represent mean and SD per CSF stage, respectively. *: p<0.05; **: p<0.01; ***: p<0.001. Abbreviations: Aβ, amyloid-β; AD, Alzheimer’s disease; CI, confidence interval; CU−, cognitively unimpaired amyloid negative; CSF, cerebrospinal fluid; LOESS, locally estimated scatterplot smoothing; mPACC, modified preclinical Alzheimer’s cognitive composite; NfL, neurofilament light; PET, positron emission tomography; ROI, region of interest.

