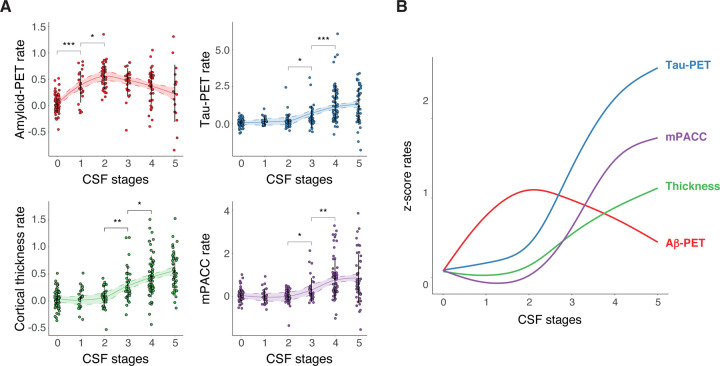
Fig 4: Longitudinal rate of change of AD biomarkers by CSF stages.
Depiction of individual biomarker longitudinal rates of change by CSF stage in BioFINDER-2 participants (A). These include biomarkers of amyloid (amyloid-PET) and tau (tau-PET in the meta-temporal ROI) pathologies, neurodegeneration (cortical thickness in the AD signature) and cognition (mPACC). Biomarkers are z-scored based on a group of CU− participants (n=63) and all increases represent increase in abnormality. Rates of change were calculated with individual linear regression models. Significant differences in contiguous CSF stages are shown with asterisks. Smoothed LOESS lines of all AD biomarkers are shown in B for comparison. All participants were included in amyloid- and tau-PET analyses. For neurodegeneration (cortical thickness) and cognitive (MMSE) measures, we excluded non-AD dementia patients to avoid bias. CSF stage 0 represent being classified as normal by the model. Black dots and vertical lines represent mean and SD per CSF stage, respectively. *: p<0.05; **: p<0.01; ***: p<0.001. Abbreviations: Aβ, amyloid-β; AD, Alzheimer’s disease; CI, confidence interval; CU−, cognitively unimpaired amyloid negative; CSF, cerebrospinal fluid; LOESS, locally estimated scatterplot smoothing; mPAC, modified preclinical Alzheimer’s cognitive composite; PET, positron emission tomography; ROI, region of interest.

