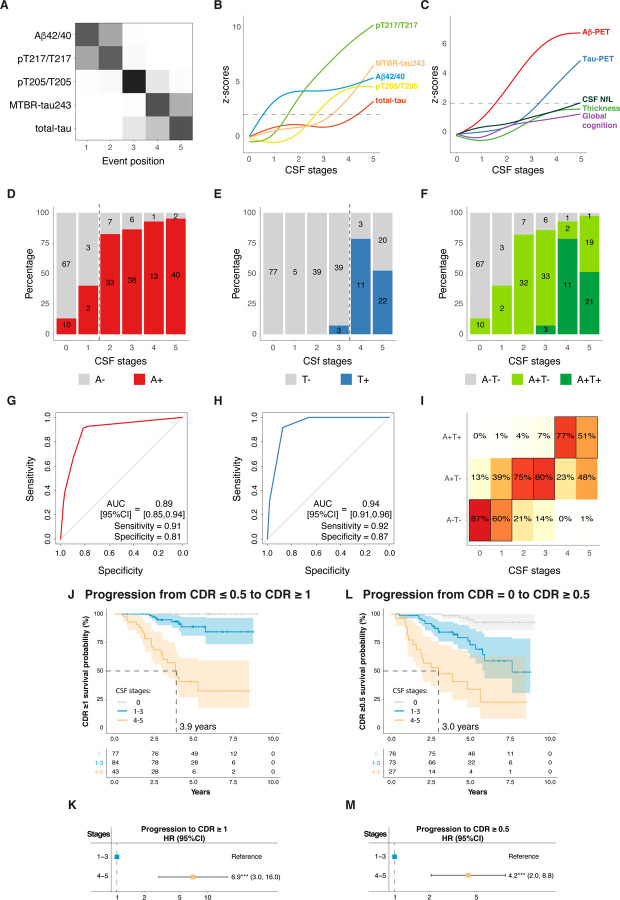
Fig 6: Replication of main analyses in Knight-ADRC participants.
Description of the model is shown in A-B. Cross-validated confusion matrix of the CSF biomarkers of the model is shown in A. Biomarkers are sorted by the time they become abnormal based on the results of SuStaIn. Darkness represents the probability of that biomarker of becoming abnormal at that position, with black being 100%. Only amyloid-positive participants are included in this analysis. Description of the CSF levels of the biomarkers included in the model by CSF stage are shown in B for all Knight-ADRC participants. Depiction of individual biomarker levels, not used in the creation of the model, by CSF stage are shown in C. These include biomarkers of amyloid (amyloid-PET) and tau (tau-PET in the meta-temporal ROI) pathologies, neurodegeneration (cortical thickness in the AD signature areas and CSF NfL) and cognition (global cognitive composite). CSF and AD biomarker levels are z-scored based on a group of CU− participants (n=71) and all increases represent increase in abnormality. Horizontal line is drawn at z-score=1.96 which represents 95%CI of the reference group (CU−). CSF stage 0 represent being classified as normal by the model. Prediction of amyloid-PET (D-G), tau-PET (E-H) and A/T status (by PET, F-I) are shown next. Number of participants in each category are colored in D, E and F. Numbers of participants in each category per CSF stage are shown within the barplots. In G and H, ROC curves were used to determine the CSF stage to optimally classify participants into positive/negative in each case. AUCs, sensitivity and specificity measures from these analyses are shown in the plot. The optimal cut-off in each case is shown as a vertical dashed line in D and E, respectively. Ordinal logistic regression was used for assessing A/T status (I). The heatmap represent the predicted percentage of participants in each A/T group per CSF stage. The most probable (highest percentage) group per CSF stage is framed in black. Amyloid-PET was considered positive if Centiloids>20, tau-PET was considered positive if SUVR at meta-temporal ROI was higher than 1.32. An A−T+ participant (n=1) was excluded from the A/T status analysis. Higher CSF stages groups (4–5) show higher HR of clinical progression compared to lower stages (reference: 1–3, J-M). Progression from CDR=0 or CDR=0.5 at baseline to CDR≥1 is shown in J-K. Progression from CDR=0 at baseline to CDR≥0.5 is shown in L-M. Kaplan-Meier curves, as well as the number of participants per group and timepoint are shown in J and L. Cox-proportional hazards models were used to calculate HR[95%CI] of higher CSF stages (4–5) compared to the reference (1–3, K and M). These analyses were adjusted for age, sex in all cases, and additionally for clinical status at baseline (CDR=0 or CDR=1) if appropriate. Abbreviations: Aβ, amyloid-β; AD, Alzheimer’s disease; AUC, area under the curve; CDR, clinical dementia rating; CI, confidence interval; CU−, cognitively unimpaired amyloid negative; CSF, cerebrospinal fluid; HR, hazard ratio; LOESS, locally estimated scatterplot smoothing; MMSE, Mini-mental state examination; MTBR, microtubule binding region; NfL, neurofilament light; PET, positron emission tomography; ROC, receiver operating characteristic; SuStaIn, subtype and stage inference; SUVR, standardized uptake value ratio.

