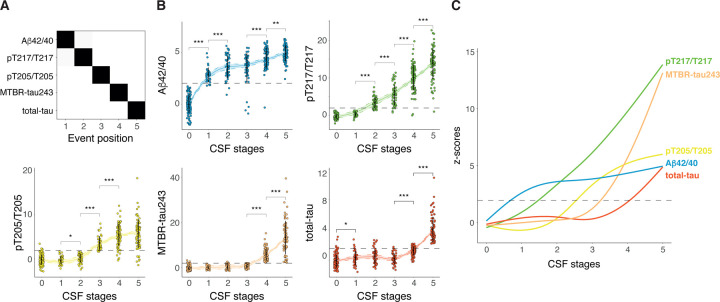
Fig 1: CSF staging model.
Description of the CSF staging model and the levels of the biomarkers included in the model by CSF stage. Cross-validated confusion matrix of the CSF biomarkers of the model is shown in A. Biomarkers are sorted by the time they become abnormal based on the results of SuStaIn. Darkness represents the probability of that biomarker of becoming abnormal at that position, with black being 100%. Only amyloid-positive participants are included in this analysis. Individual biomarker levels by CSF stage in all BioFINDER-2 participants are shown in B. CSF levels are z-scored based on a group of CU− participants (n=63) and all increases represent increase in abnormality. Significant differences in contiguous CSF stages are shown with asterisks. Horizontal line is drawn at z-score=1.96 which represents 95%CI of the reference group (CU−). Smoothed LOESS lines of all CSF biomarkers are shown in C for comparison. CSF stage 0 represent being classified as normal by the model. Black dots and vertical lines represent mean and SD by CSF stage, respectively. *: p<0.05; **: p<0.01; ***: p<0.001. Abbreviations: Aβ, amyloid-β; CI, confidence interval; CU−, cognitively unimpaired amyloid negative; CSF, cerebrospinal fluid; LOESS, locally estimated scatterplot smoothing; MTBR, microtubule binding region; pT, phosphorylated tau; SuStaIn, subtype and stage inference.

