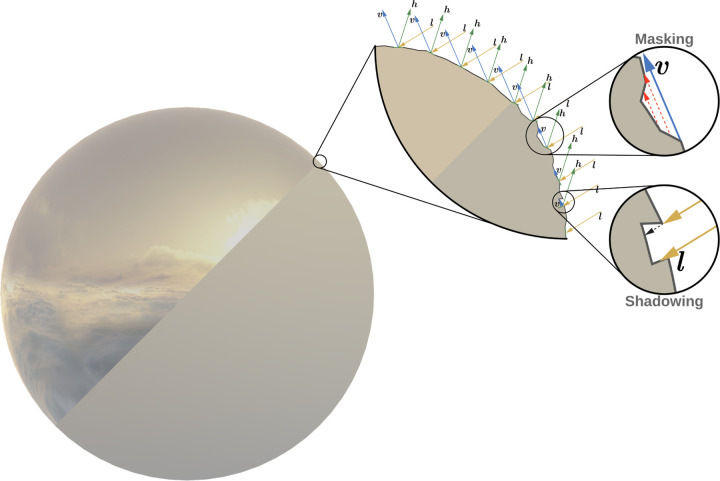
Figure 1.
Diagram of the distribution of microfacets on smooth and rough surfaces. The sphere on the left simulates two physical properties. On top is a smooth surface, and on the bottom is a rough surface. The first zoomed-in section (center) illustrates how microfacets might align on such surfaces. The rightmost section shows two different occlusion effects present on rough surfaces.

