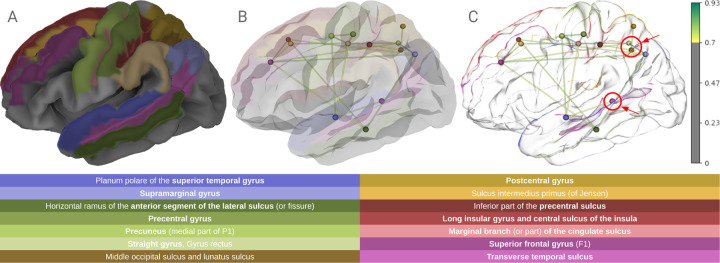
Figure 6.
Visualization customization using physically-based shading. E.g., In A, atlas regions are projected on a cortical surface. B and C display a connectivity network alongside the cortical surface. In B, the surface opacity is reduced until the graph becomes visible. While in C, sheen highlights the surface’s silhouette without compromising the opacity. This effect preserves depth information, as seen in the marked regions (red circles).

