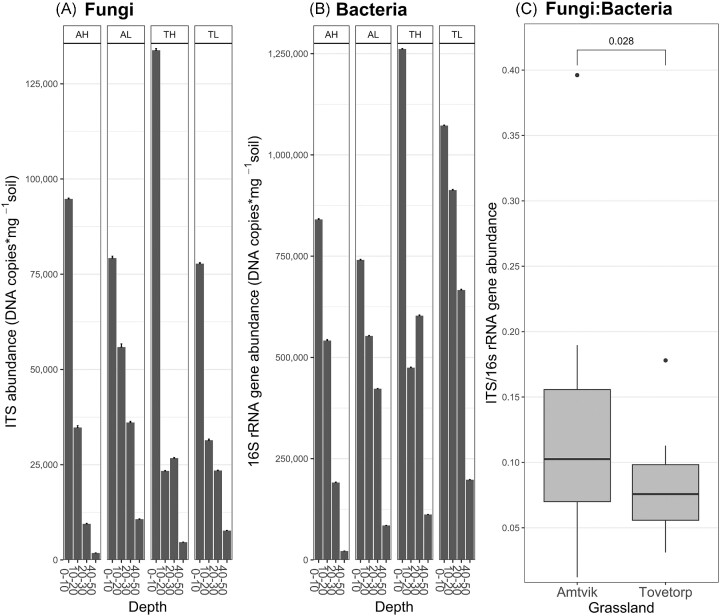
Figure 3.
Abundance of total (A) fungi ITS region and (B) bacterial 16S rRNA gene at different soil depths and sites, in two grasslands in south-eastern Sweden (A = Ämtvik and T = Tovetorp) and two catenary positions (H = high and L = low); and (C) ratio of fungal to bacterial abundance in the Ämtvik (mean = 0.117) and Tovetorp grasslands (mean = 0.078; t = 2.3, P = .028). Fungal and bacterial abundances were obtained through qPCR (DNA copies*mg−1 of DNA markers in the soil) and given as mean values (n = 3) + SE.

