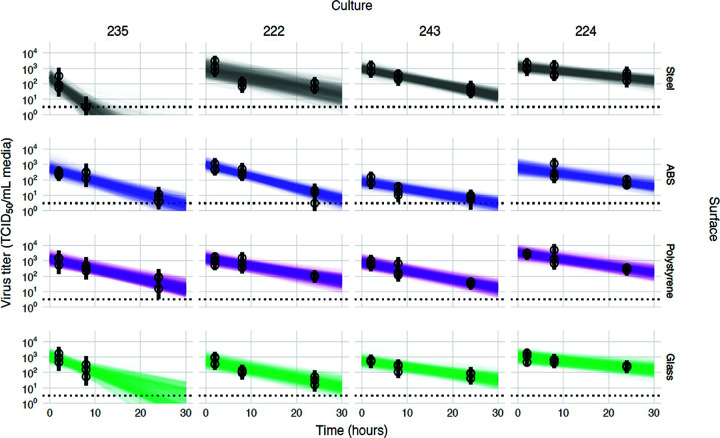
FIG 3.
Linear regression of viral stability on surfaces at 23% RH over time by HBE culture to estimate surface and culture effects. Regression lines representing predicted exponential decay of log10 virus titer over time are plotted alongside measured (directly inferred) virus titers. Predicted decay reflects the estimated effects of surface (row) and culture (column). For each experiment (surface/HBE culture pair), semitransparent regression lines visualize the inferred joint posterior distribution of the virus exponential decay rate and the individual sample intercepts (i.e., virus titers at time zero, which can vary about the mean initial titer for the experiment). Fifty random posterior draws are shown. To visualize the estimated variation in initial titers (intercepts), 6 lines are plotted per experiment per draw, one for each of 6 randomly chosen titers from that experiment (since each titer has its own estimated time zero value). This yields 300 plotted lines per experiment. A new set of 6 random titers per experiment was chosen for each draw. Points with black bars show individually estimated titers (point, posterior median titer estimate; bar, 95% credible interval). Samples with no positive titration wells are plotted as triangles at the approximate limit of detection (dotted horizontal line).

