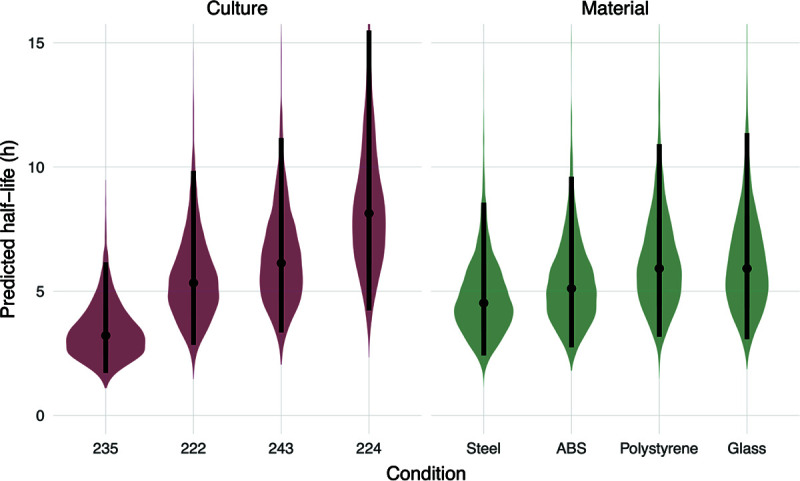
FIG 4.

Predicted half-lives based on surface material or patient-derived culture. Violin plots indicate the posterior distributions of the half-life of viable virus based on the estimated exponential decay rates of the virus in different HBE cultures on a neutral surface (left) and on surfaces with a neutral HBE culture (right), thus separating culture and surface effects. Dots indicate the posterior median estimates, and the black lines indicate a 95% credible interval (CI). Values for the median half-lives and 95% CI are presented in Table 2.
