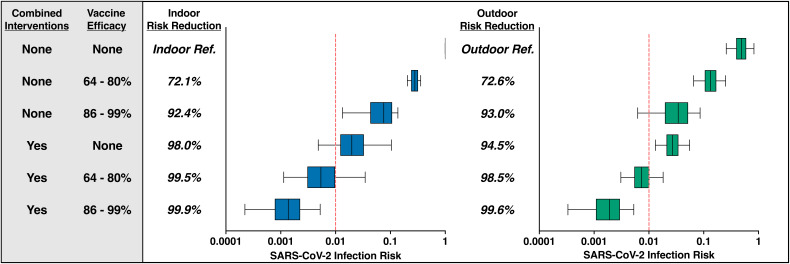
FIG 2.
Essential produce workers experience the greatest reduction in SARS-CoV-2 infection risk when vaccinations are applied in combination with recommended infection control strategies. The combined interventions column represents simultaneous surgical mask usage, hourly handwashing, surface disinfection (twice per work shift), increased physical distancing to 2 m, and an increased air exchange rate per scenario. Within the vaccine efficacy column, the 64 to 80% vaccine efficacy range represents the suboptimal vaccine, while the 86 to 99% vaccine efficacy represents the optimal vaccine, both of which represent a worker’s level of immunity to any infection, asymptomatic or symptomatic (see Materials and Methods for details). Relative risk reductions were calculated by comparing the risk estimate per intervention scenario against the baseline (no intervention, 1-m work shift distance) risk estimate. The top row represents the baseline (reference) daily cumulative infection risk for an indoor (left) and outdoor (right) produce worker across the 2 h of shared transportation, 12-h work shift at 1 m, and 10 h of shared housing scenario (outdoor worker only) with no infection control strategies applied. The median risk of infection is denoted by the line within each box plot, with error bars representing the 95% uncertainty interval. Finally, a vertical line has been added to denote a 24-h infection risk of 1.0%.

