FIG 3.
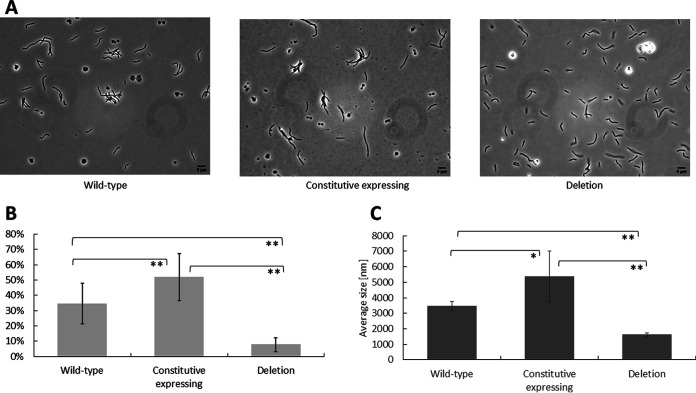
(A to C) Phase-contrast microscopy pictures of three M. thermautotrophicus ΔH strains (A) as representative pictures on which the analysis of the cell-cell connections was based (B); the average cell-cluster size was measured with a Zeta analyzer (C). (A) Representative phase-contrast microscopy pictures of the three analyzed strains, the wild-type, the constitutive Mth60-fimbria expression strain, and the Mth60 fimbria deletion strain of M. thermautotrophicus ΔH. (B) Comparison of the three M. thermautotrophicus ΔH strains mentioned above regarding the total number of microbial cells with the number of cells connected to another cell in percentage. Average (N = 3, n = 10) with error bars indicating the standard deviation. Significance was tested with ANOVA (F [102.6] > Fcrit [3.2]), followed by individual Student’s t test (two-tailed) between two respective strains; *, significant difference (P < 0.05); **, highly significant difference (P < 0.01). (C) Results of Zeta analyzer analysis regarding average particle size in nm of the microbial cell clusters of the three M. thermautotrophicus ΔH strains depicted in panel A. The same statistical approach was followed as for panel B with ANOVA (F [21.5] > Fcrit [3.4]), and asterisks reflect the same confidence intervals of the P value.

