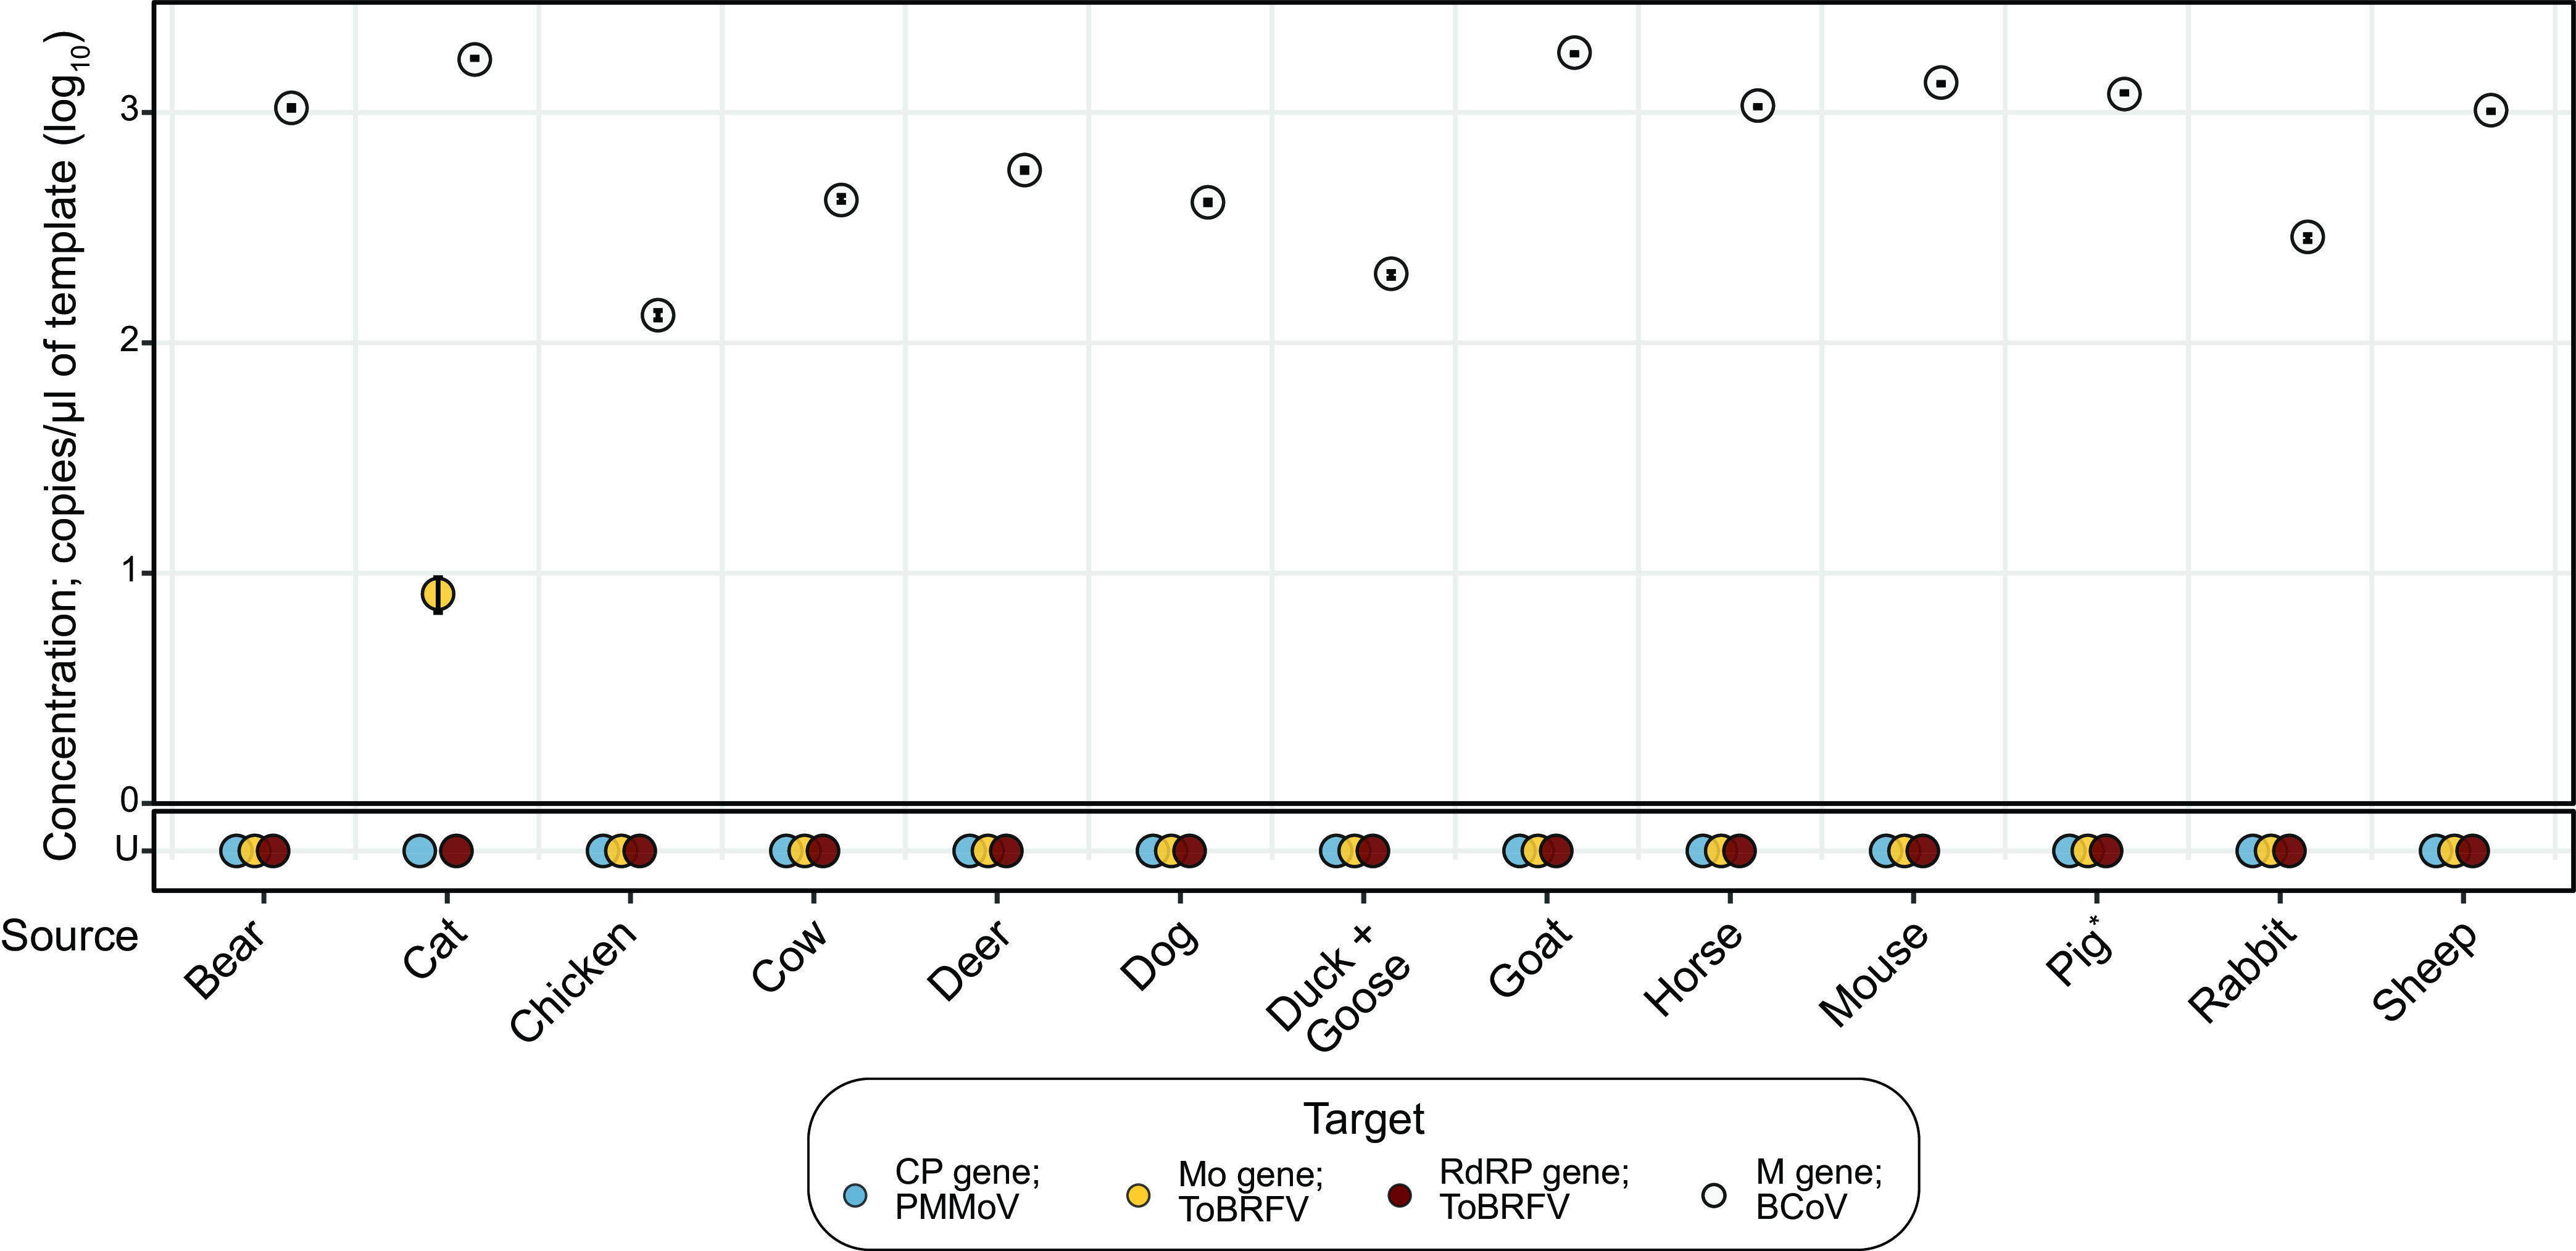
FIG 3.

Concentrations of PMMoV and ToBRFV target genes in animal stool samples. Dot plot marking the concentrations of the PMMoV CP (blue), ToBRFV Mo (yellow) and RdRP (red) genes from the undiluted templates. Concentrations of BCoV M gene, used as a control, are marked by white dots. Error bars marking the standard deviation are plotted along with the dots and are mostly subsumed within the dots. The x axis shows 13 samples from 14 different animals, as a single sample was derived from cohoused ducks and geese. The y axis shows concentrations of the genes. U, undetermined (samples with no detectable gene). *Note that 1:10-diluted RNA template from a pig’s stool indicated 7.47 log10 copies/μL of template of the PMMoV CP gene.
