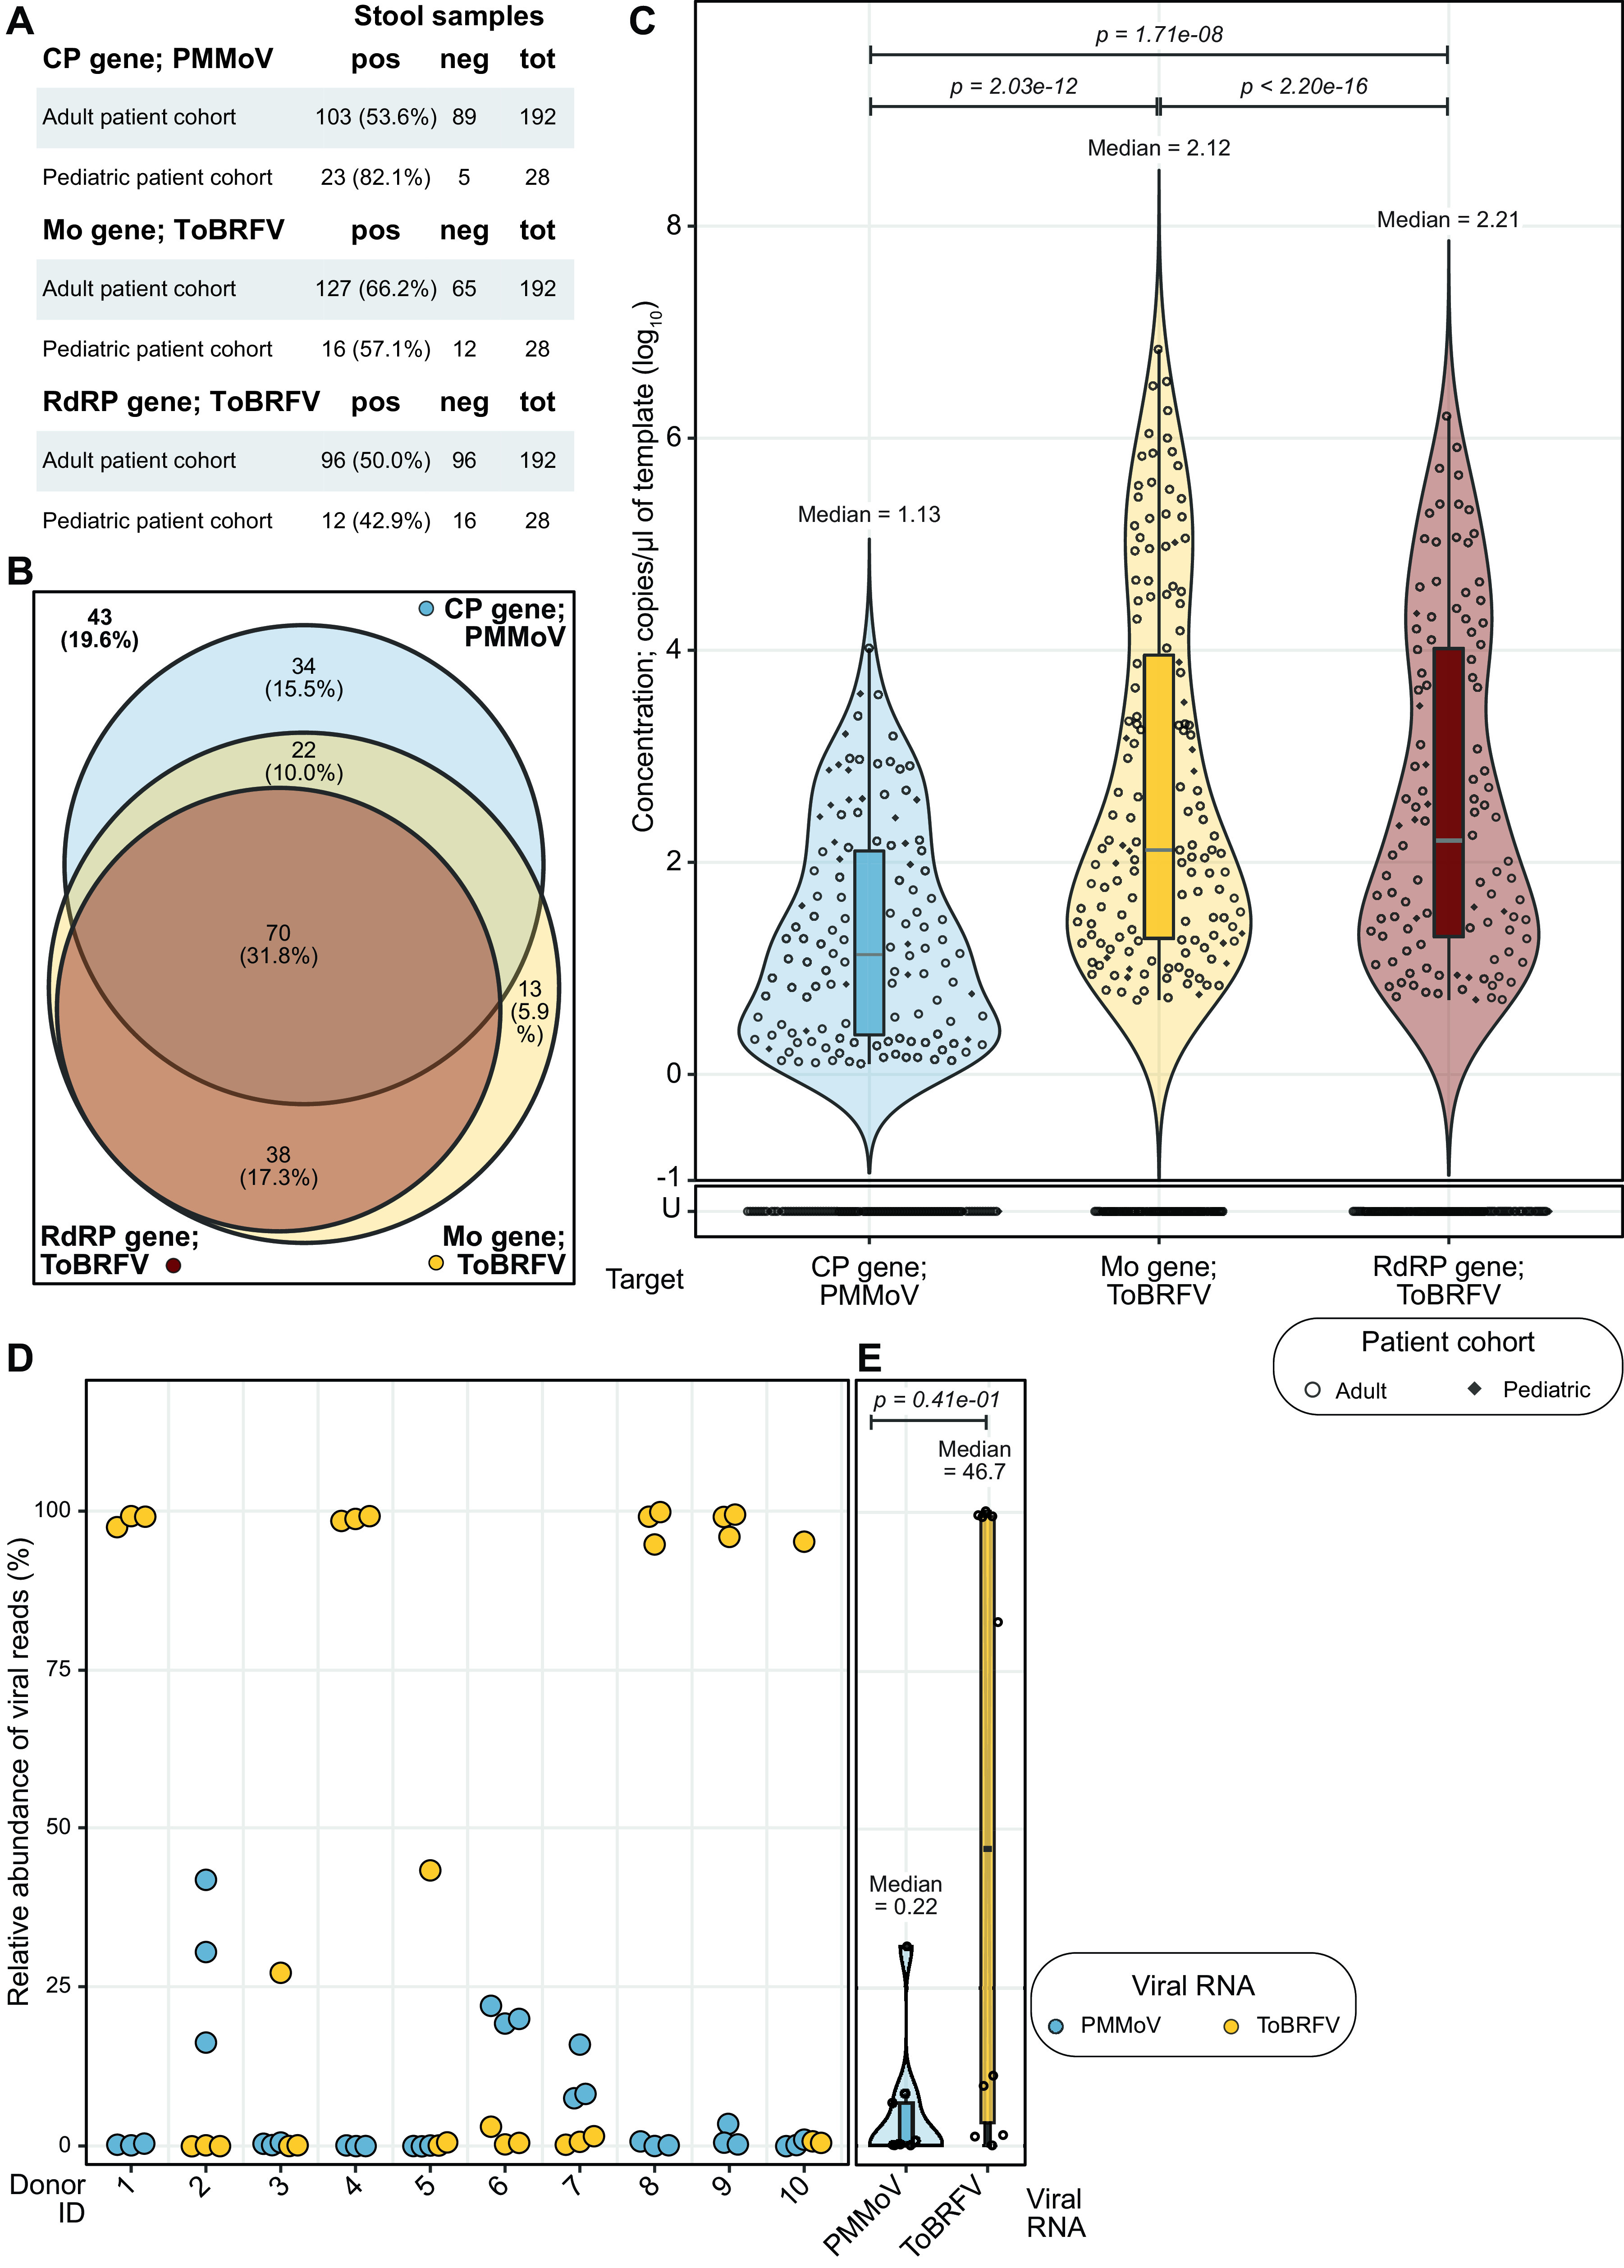
FIG 4.

Prevalence of PMMoV and ToBRFV target genes in human stool samples. (A) Tabular summary of detection of the three gene targets in samples from adult and pediatric cohorts. The first column lists the name of the target gene and cohort, followed by the number and percentage of samples that were positive (pos) or number of samples that were negative (neg) for that target gene and the total number of samples tested (tot). (B) Venn diagram summarizing the detection of the PMMoV CP gene (blue) and the ToBRFV Mo (yellow) and RdRP (red) genes across 220 human stool samples. In 34 (15.5%), we detected only the PMMoV CP gene, while 13 (5.9%) had only the ToBRFV Mo gene. In 38 (17.3%) samples, we detected both ToBRFV target genes, while 22 (10.0%) had both the PMMoV CP gene and ToBRFV Mo gene. In 70 (31.8%) samples, we detected all three gene targets, while 43 (19.6%) had none of them. (C) Dot plot marking the concentrations of PMMoV CP (blue), ToBRFV Mo (red) and RdRP (yellow) genes, with violin and box plots summarizing their distributions, in RNA extracted from stool samples collected from humans. The x axis marks the target genes, and the y axis shows their concentrations. U, undetermined (samples with no detectable gene target above the LoB). The concentration of the PMMoV CP gene had a median of 1.13 with a standard deviation of 1.00 and IQR of 1.74 log10 copies/μL of template, the ToBRFV Mo gene had a median of 2.12 with a standard deviation of 1.69 and IQR of 2.67 log10 copies/μL of template, and the ToBRFV RdRP gene has a median of 2.20 with a standard deviation of 1.56 and IQR of 2.72 log10 copies/μL of template. P values derived from paired Wilcoxon signed-rank tests with continuity correction and excluding samples with undetermined concentration across all combinations of the three gene targets are listed at the top of the plot. (D) Dot plot marking the relative abundance of viral reads of PMMoV (blue) and ToBRFV (yellow) from previously published metatranscriptomics data derived from healthy stool samples. The x axis shows the 10 donors who provided samples, and each sample provided RNA sequences in biological triplicate; each dot denotes a single replicate. The y axis shows relative abundance. (E) Dot plot summarizing data from panel D, now including violin and box plots to highlight distribution of viral RNA concentrations and associated statistics. The x axis marks the target viral RNA, and the y axis shows their relative abundance in percent. Dots represent the averages of data from three biological replicates. PMMoV (blue) is present at a median relative abundance of 0.217% with a standard deviation of 9.83% and IQR of 5.19%, ToBRFV (yellow) is present at a median relative abundance of 46.7 with a standard deviation of 48.5% and IQR of 95.4%. The P value at the top was derived from a Wilcoxon signed-rank test of pairwise differences in relative abundance with continuity correction and excluding samples with undetermined concentration.
