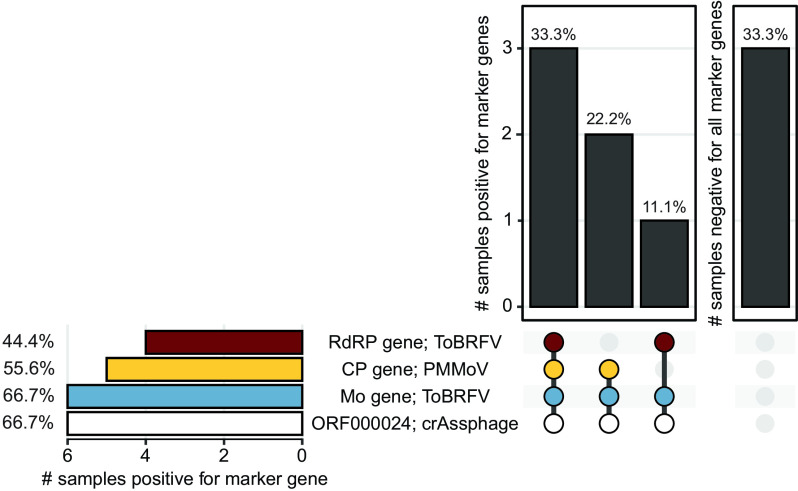
FIG 6.
Prevalence of PMMoV, ToBRFV, and crAssphage target genes in stormwater samples from across California. UpSet plot summarizing the number of stormwater samples (total n = 9) that are either positive for multiple marker genes (left) or negative for all marker genes (right) in the vertical bar plots. Marker genes are listed under the plots, with colored dots representing presence and gray dots representing absence. Marker genes present in samples represented in the vertical bar are also connected by a thick line. The prevalence of independent marker genes is also summarized in the horizontal bar plot. All bars present data as percentages. Blue, PMMoV CP gene; yellow and red, ToBRFV Mo and RdRP genes, respectively; white, crAssphage ORF000024. Data for crAssphage were derived from a previous study (22).

