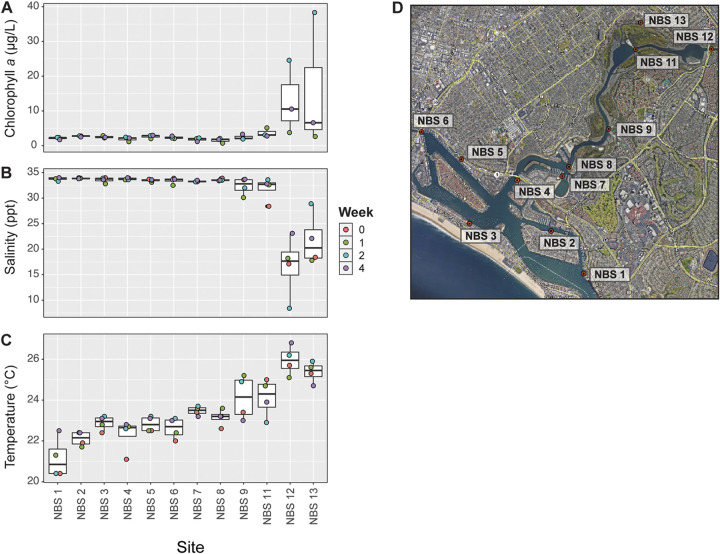
FIG 1.
(A to C) Experimental sites and environmental conditions at the time of sample collection, including chlorophyll a concentration (A), salinity (B), and temperature (C). (D) Sites in Newport Bay, CA, where oysters were deployed and water and oyster samples were collected for the study. Map was generated using Google Earth with the following data attributions: Google, CSUMB SFML, CA OPC, USGS.

