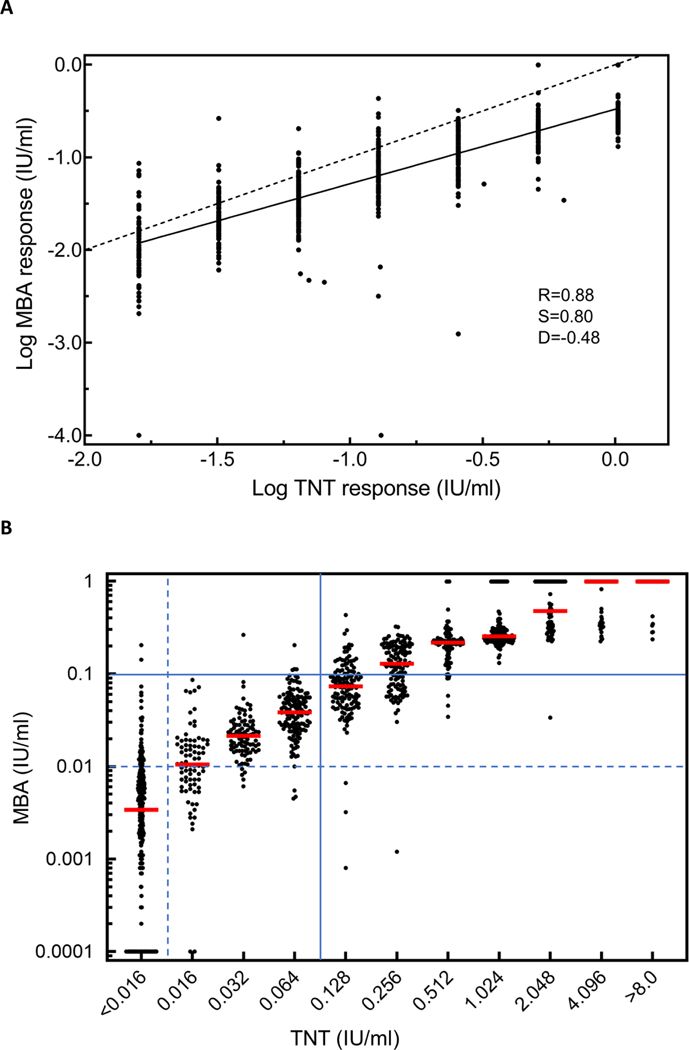
Figure 1. Scatterplots of the logarithm of diphtheria toxoid antibody levels (n=1,300 specimens) by multiplex bead assay (MBA) vs. a reference toxin neutralization test (TNT).
(A) Inter-assay comparison of diphtheria antitoxin levels by MBA and TNT by linear regression (solid line) using values ranging 0.016 to 1.024 IU/ml by TNT (n=789). The line of identity (dashed line) is shown for reference. Spearman’s rank correlation coefficient (R), the slope of the regression (S), and the y-intercept (D) were calculated. (B) Points are jittered to better visualize the distribution of MBA responses relative to individual titers in the TNT. Median MBA responses for each TNT antibody titer are shown in red. Cutoffs at 0.01 IU/ml (dashed) and 0.1 IU/ml (solid) are shown in blue.

