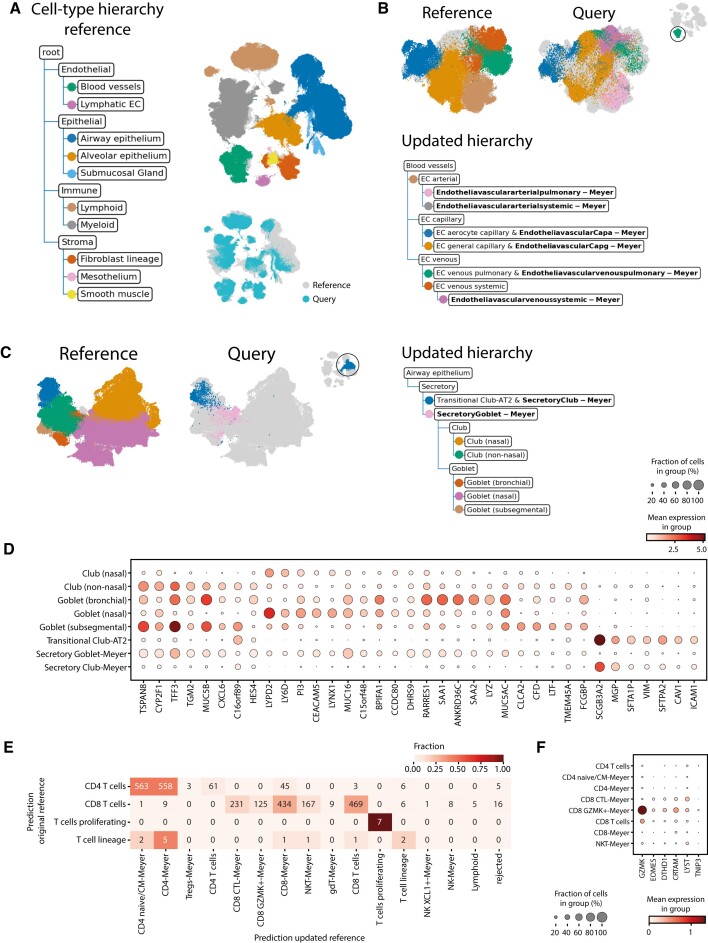
Figure 2.
Updated hierarchy when adding Meyer to the reference atlas. (A) The cell-type hierarchy corresponding to the reference atlas (only the first two levels are shown). Each node represents a cell type in the reference atlas instead of a cell type in a separate dataset of the reference atlas. The UMAP embedding shows the aligned reference and query dataset. The cells in the reference dataset are colored according to their level 2 annotation. (B, C) Updated hierarchy zoomed in on the blood vessels and airway epithelium secretory cells respectively. The UMAP embeddings are colored according to their finest resolution. (D) Expression of marker genes for club and goblet cells in the reference and query cell types. (E) Comparison of the predictions using the original and updated reference on the T-cells of the Tata dataset. (F) Expression of marker genes for CD8 + GZMK + cells.

