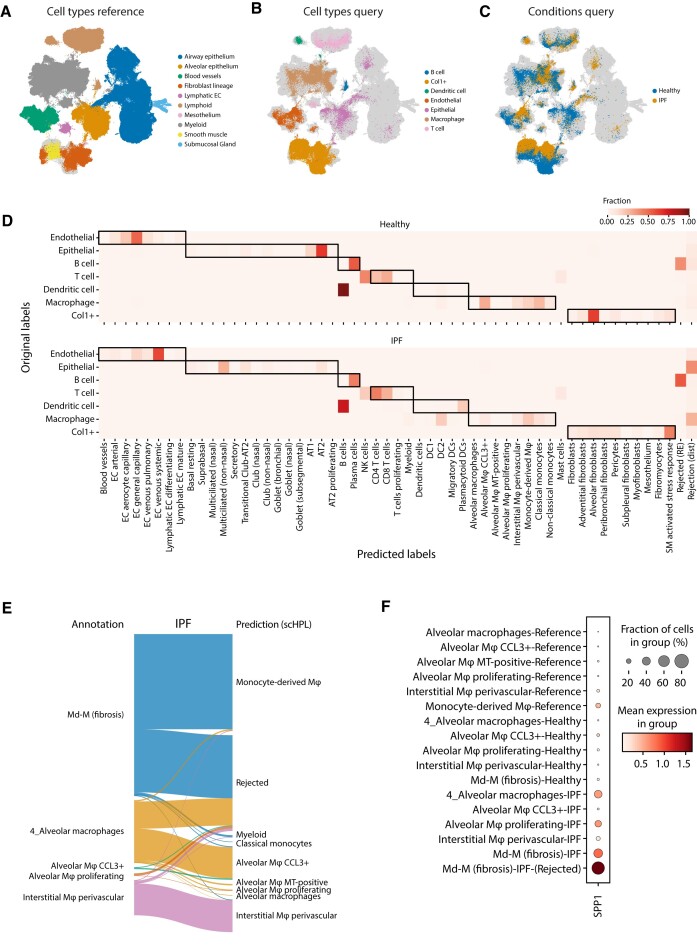
Figure 3.
Identifying diseased cells in IPF data. (A–C) UMAPs show the HLCA and IPF datasets after alignment. The cells are colored according to their cell type or condition. (D) Heatmap showing the predicted labels by scHPL and original labels. The dark boundaries indicate the hierarchy of the reference tree. (E) Sankey diagram showing the new annotations and predictions for the macrophages for the IPF condition. (F) Expression of SPP1 in the different cell types of the reference and query datasets.

