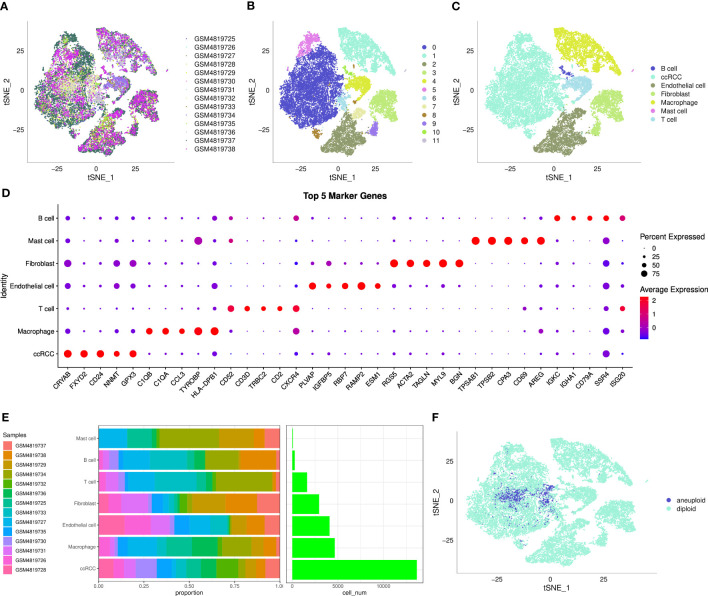
Figure 1.
The single-cell landscape of clear cell renal cell carcinoma. (A) t-SNE plot showing the distribution of 14 samples; (B) t-SNE plot showing the distribution of subclusters after clustering; (C) t-SNE plot showing the distribution of cells after annotation; (D) dot plot showing the expression of the top 5 marker genes in annotated subclusters; (E) proportion and the number of cells in annotated subclusters across samples; (F) distribution of malignant and non-malignant cells predicted by copykat.

