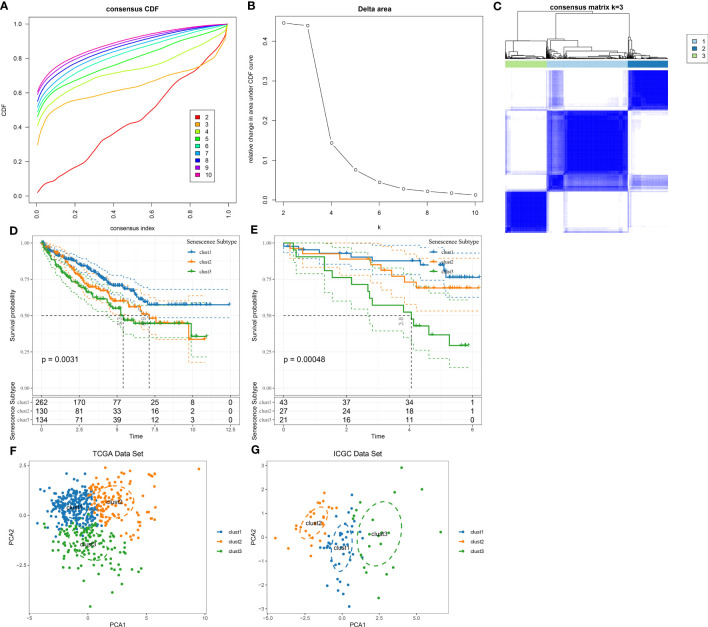
Figure 4.
Identification of senescence-related subtypes in ccRCC. (A) CDF curve of TCGA cohort samples; (B) Delta area curve of consensus clustering for TCGA cohort samples, indicating the relative change in area under the cumulative distribution function (CDF) curve for each category number k compared with k-1. The horizontal axis represents the category number k, and the vertical axis represents the relative change in area under the CDF curve; (C) Sample clustering heatmap at consensus k=3; (D) KM curves of three subtypes for prognosis in TCGA cohort; (E) KM curves of three subtypes for prognosis in ICGC cohort; (F) PCA analysis based on senescence-related genes in TCGA dataset; (G) PCA analysis based on senescence-related genes in ICGC dataset.

